Comprehensive guide to JavaScript performance analysis using Chrome DevTools
Let's see how to navigate the Chrome Devtools Performance tab to effectively analyse and improve the performance of your JavaScript while avoiding common errors. Our use case will be improving the rendering FPS of a real-world canvas library.
A few weeks ago a colleague of mine and I were looking at the canvas engine comparison benchmarks on benchmarks.slaylines.io. The benchmark lists several of the most popular solutions and allows easy comparison of performance in rendering thousands of rects on a canvas.
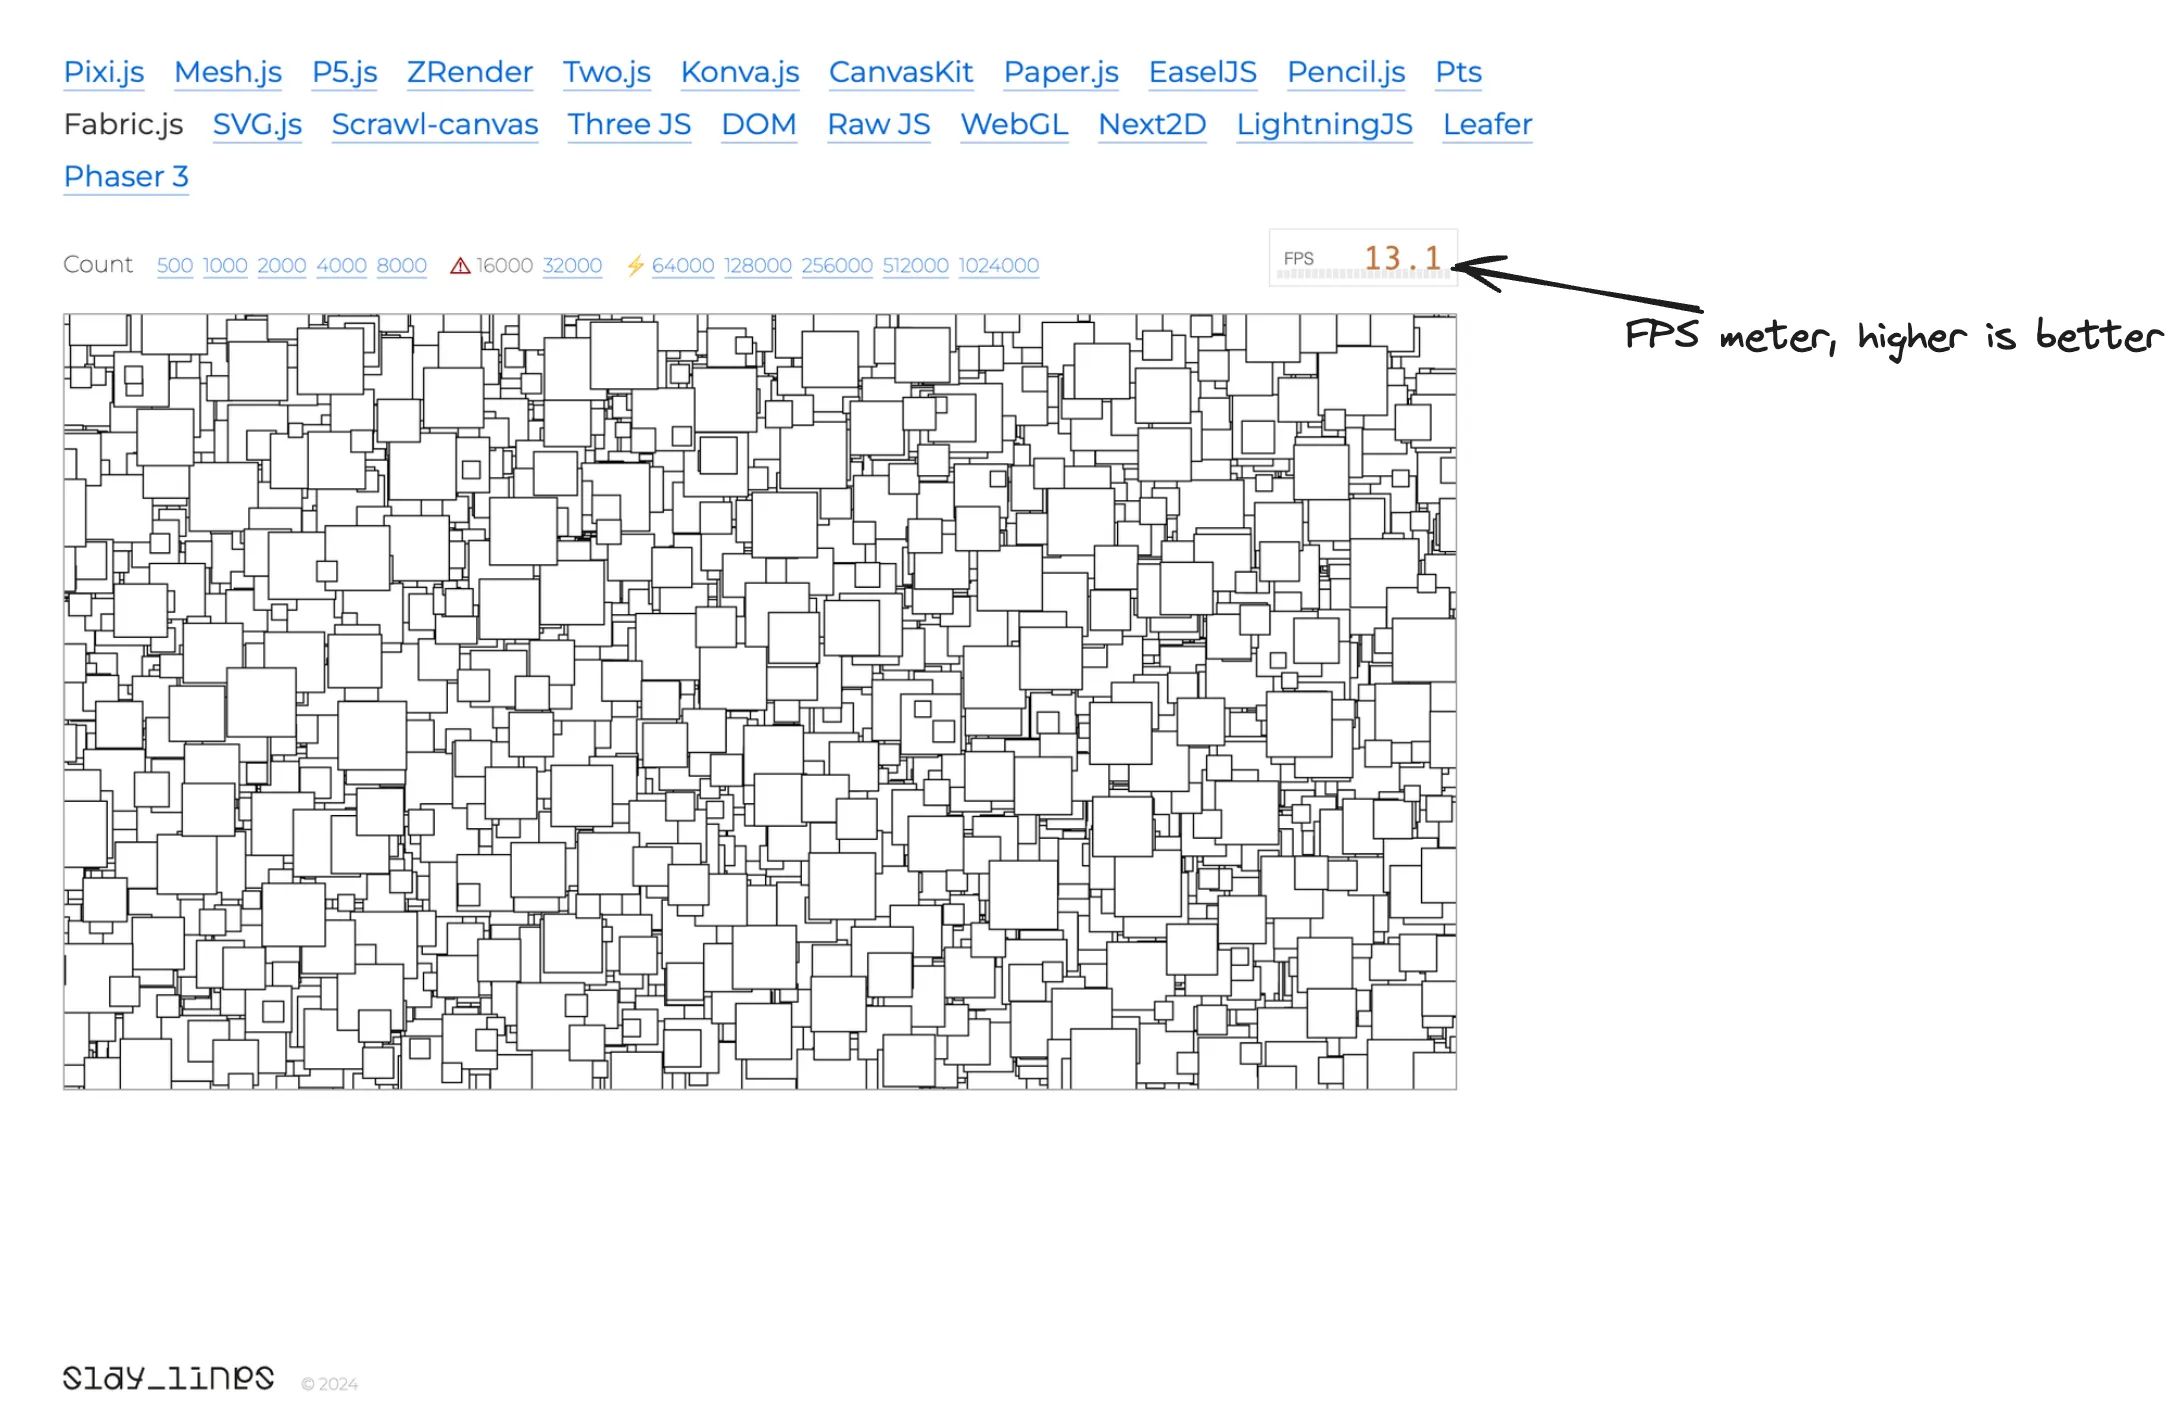
At work we both use fabric.js, which is a canvas engine library focused on interactivity, often at the expense of performance. However, we had no idea of “how much at the expense of performance” it was until we looked at the benchmark which animates 16 000 objects continuously! Despite the premises, in under 2 hours of a cracked Teams meeting, we were able to improve the Frame per Second (FPS) rendering from around 13fps to almost 50fps, measured on M2 Pro. That’s a 4x or 400% improved performance, in under 2 hours as well!
Most of the changes were not even canvas-specific optimisations, such as we did not change from CanvasRenderingContext2D to WebGLRenderingContext. So I thought why not use the case to show how we used the Performance tab on Chrome DevTools to measure, investigate and improve the JavaScript execution time of the library? While Chrome has good documentation on how to get started with Analysing runtime performance, it’s more just an introduction and the #analyse the results section is far from being complete in explaining how to find where you can improve, especially in non-trivial cases.
Table of Contents
- A first overview of the Performance results
- Analysing the flame chart
- Improve canvas rendering performance
- Final look at the Performance recording
A first overview of the Performance results
Throughout the article, you can try out the performance analysis and optimisations using the following Code Sandbox. I’ve prepared a small little clone of the benchmark:
In the fabric.js file, you’ll find the OptimisedRect class which allows to override some fabric.Object class methods that will have a strong impact on performance. To measure the performance I recommend opening the Sandbox preview in a new window (by clicking the top-right icon) so that the benchmark lives on its own page, not in an iframe.
Let’s start by hitting the Record button on the Performance tab of the Chrome Devtools and have a first look at the results. Because we’re handling continuous re-rendering in this case, we need to record just a few seconds as the execution will repeat periodically.
There’s no doubt that the Performance results are screaming “inefficient!” at us.
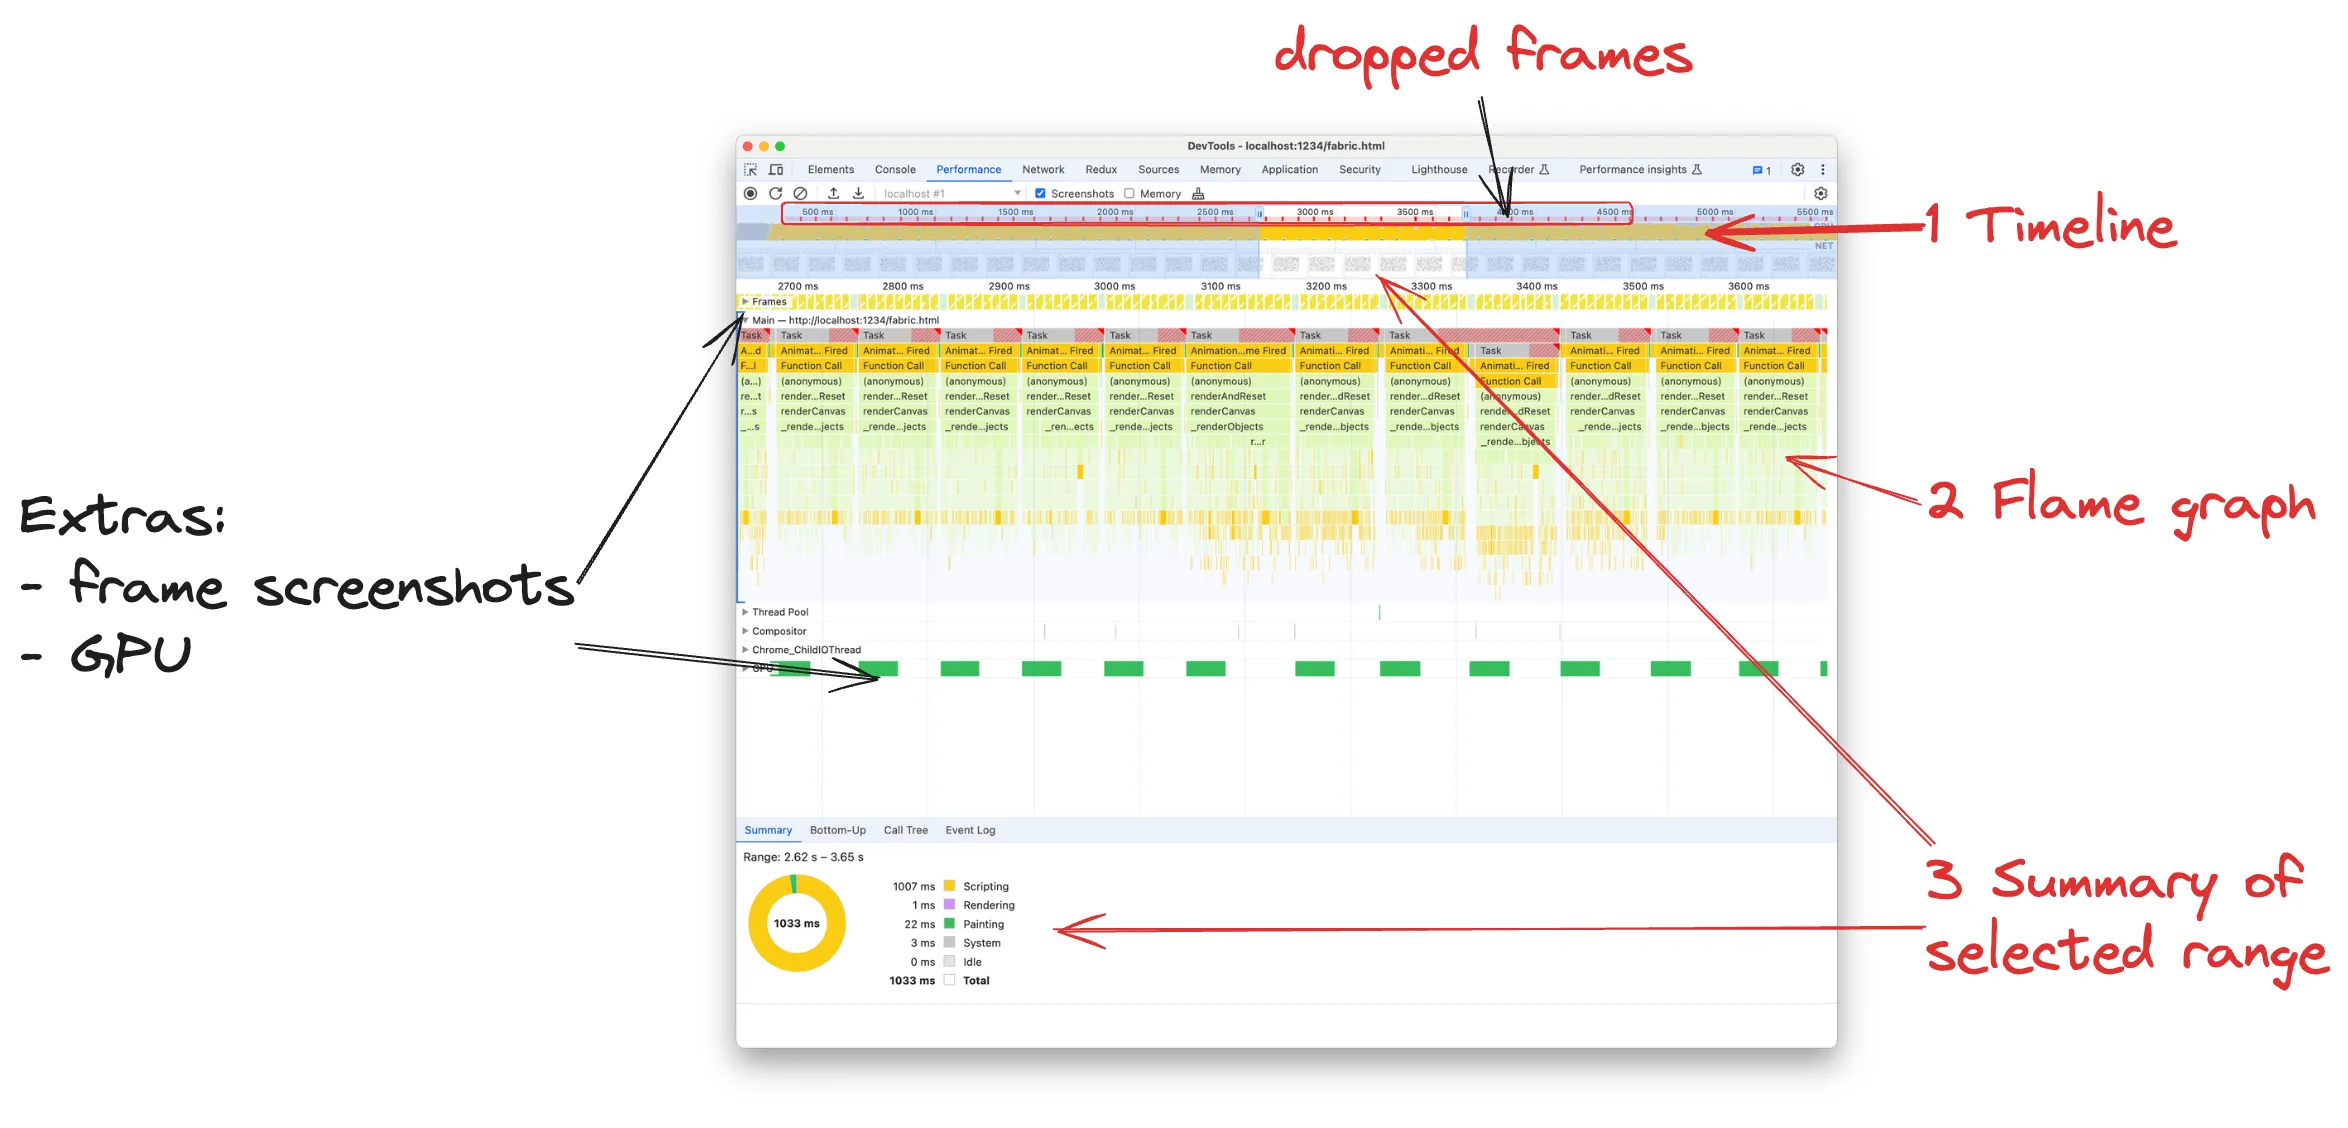
Timeline
The Timeline shows what the browser is busy doing during the recording. Each colour represents a different kind of computation, but typically what we look for is the yellow representing JavaScript execution. A typical timeline has some spikes of yellow area, where the browser is most busy running JavaScript and dropping frames:
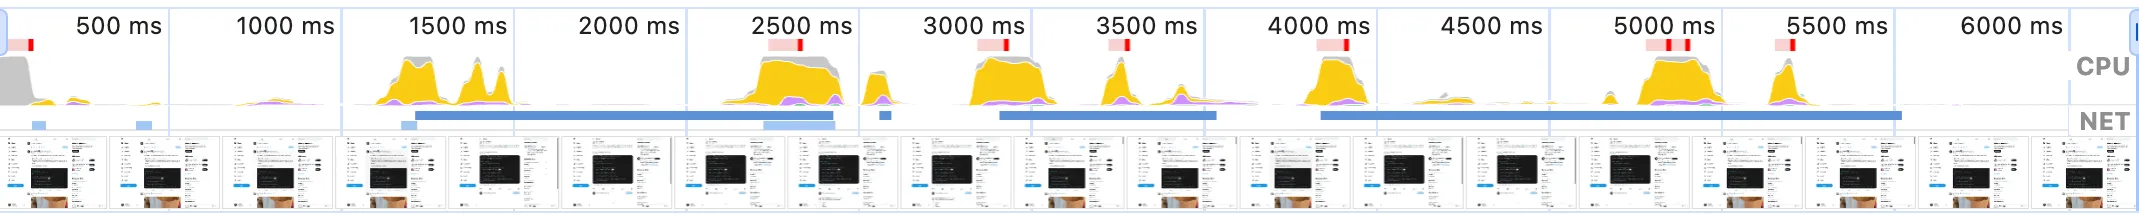
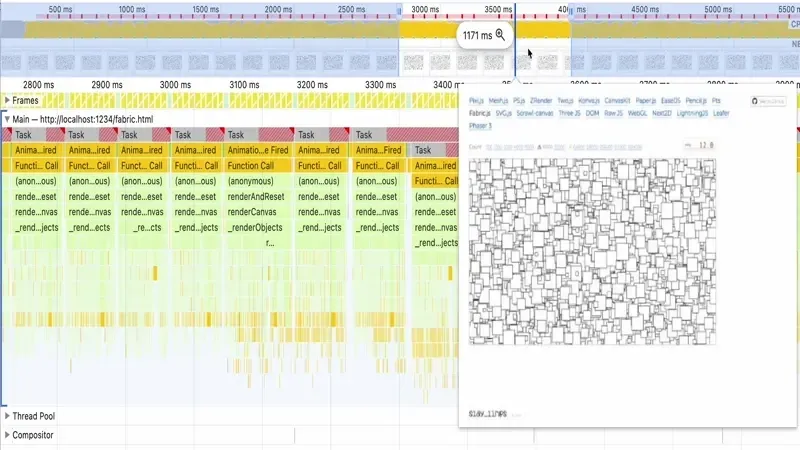
Occasionally dropping some frames is inevitable and okay if we’re building any non-trivial application. On the timeline, we look for ranges where the yellow spikes last at least half a second. They correspond to moments where many frames were dropped. Screenshots at the bottom of the timeline are very useful to understand what’s happening on the page. For instance, in our case we can see that the rectangles are moving:
A long yellow rectangle means that the CPU is busy executing JavaScript all the time, without any idle moments. That would not be a problem since we’re continuously animating and re-rendering the rects on the canvas, but the red line and the multiple red dots on top of the timeline indicate that many frames were dropped because the browser was busy doing JavaScript instead of rendering the page. Not surprisingly, the benchmark is showing 12-13fps on the FPS meter.
FPS should be above at least 24 to be not perceived as laggy. 30fps is a good result, 60fps is great and smooth, 120fps is godly. We want to achieve at least 30fps, which means being able to render 30 times in a second, i.e. 1000 / 30 = 33ms is the total time we have for each frame. That includes executing our own JS to update the rects’ on the canvas and browser’s Rendering phases. So it’s actually less than 33ms.
You may think FPS matters only for animations, canvas or games but any web page needs to be re-rendered smoothly actually. Even if you’re just moving your mouse around and hovering links or buttons you need the browser to re-render the page and display the hovered button with a different background. In case you’re wondering then “How do I get an FPS meter if I’m not using a canvas?” you can get one from the Chrome Devtools by enabling FPS Rendering Stats by clicking on the three dots menu on the top right of the Devtools > More tools > Rendering.

Summary
The Summary is telling us how the time is divided in the selected timeline range. In our case, we have selected the range between 2.62s - 3.65s, so roughly 1s, and that time is basically spent entirely running JS (yellow Scripting). The browser is only taking 22ms for itself to do the actual painting.
While the Summary tab does not help with pointing down the performance bottlenecks, it’s a good general indicator to get started. And as we go deeper into the analysis it will display really useful information regarding what we select on the flame graph.
Flame chart
Flame charts are a graph visualisation of the call stacks of our functions, at a glance, we can see who calls what. Each node on the graph corresponds to a function and traversing the graph with your eyes means following the code path. I’m a big fan of data visualisation and I think flame graphs are one of the best visualisation tools in general.
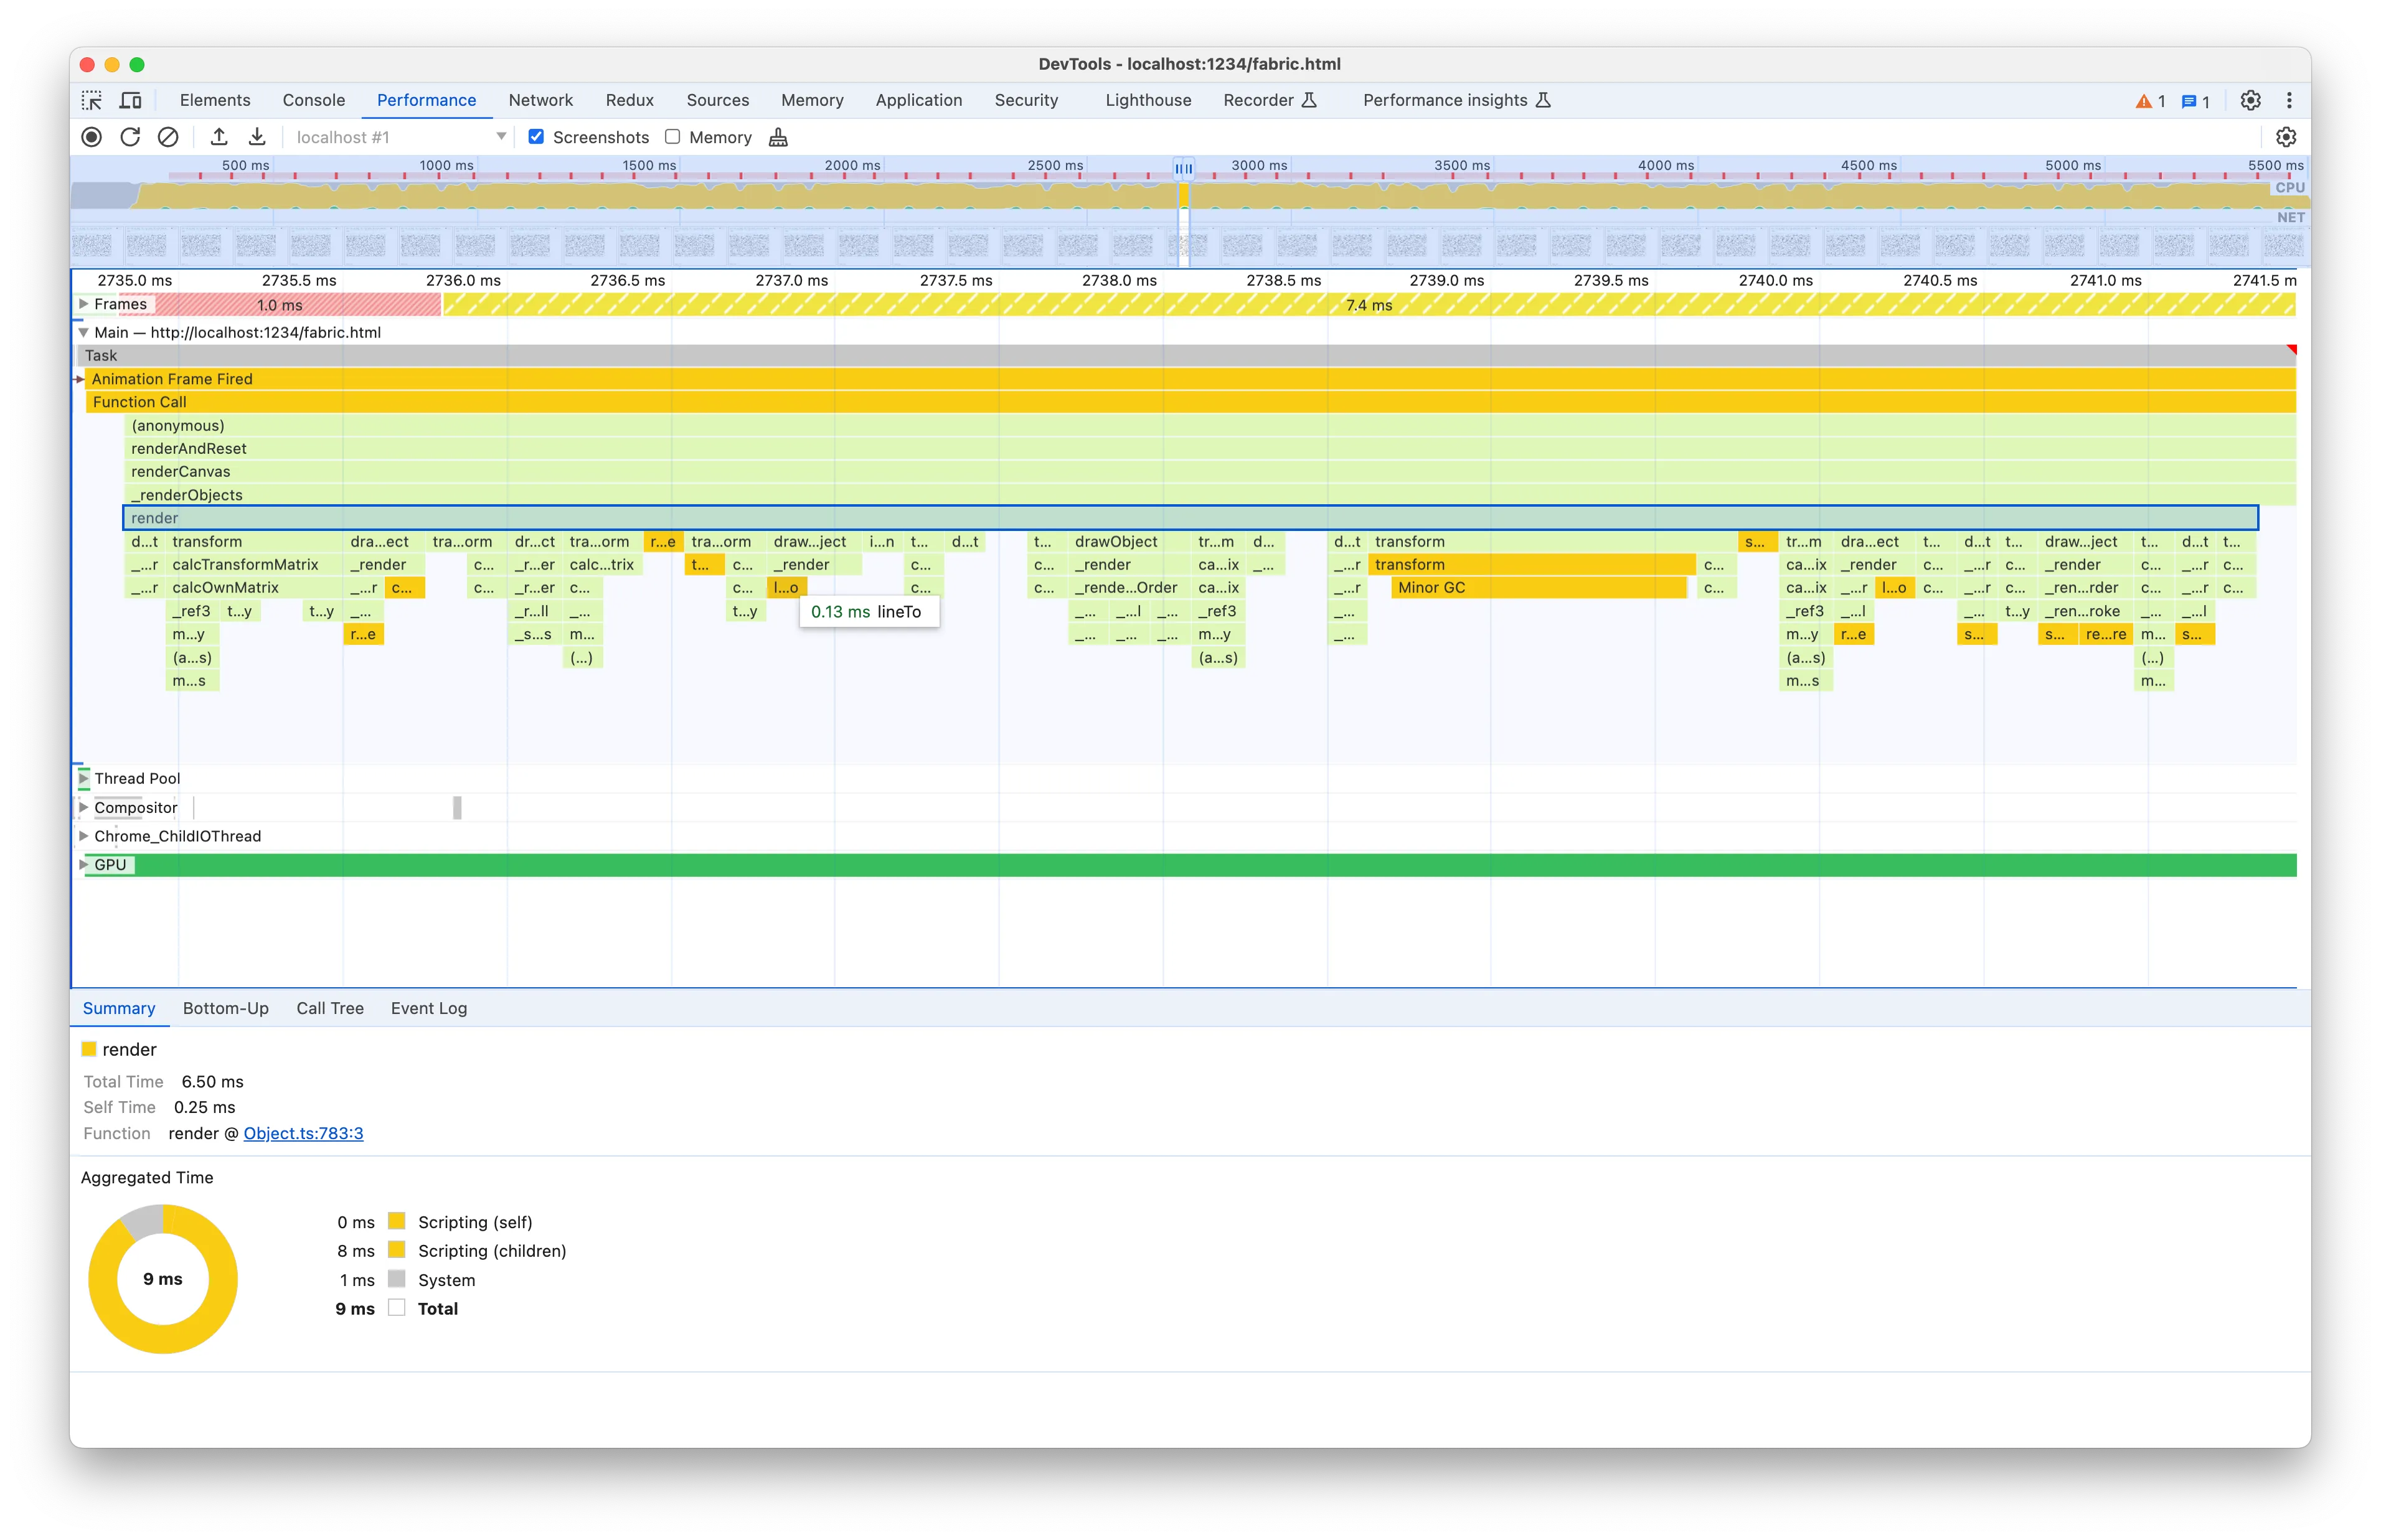
In the context of JavaScript and Chrome, the flame graphs show the top-to-bottom call stack, from the caller to the callee. Then the flame graph area is divided into sections, one graph for each event loop task. In our case, since we’re animating, each task is a requestAnimationFrame callback because that’s the “trigger” that starts our task. In JS, since we have the event loop, the browser is idle unless there’s an event that triggers a task, i.e. a mouse event, a Network event, a timeout firing etc.
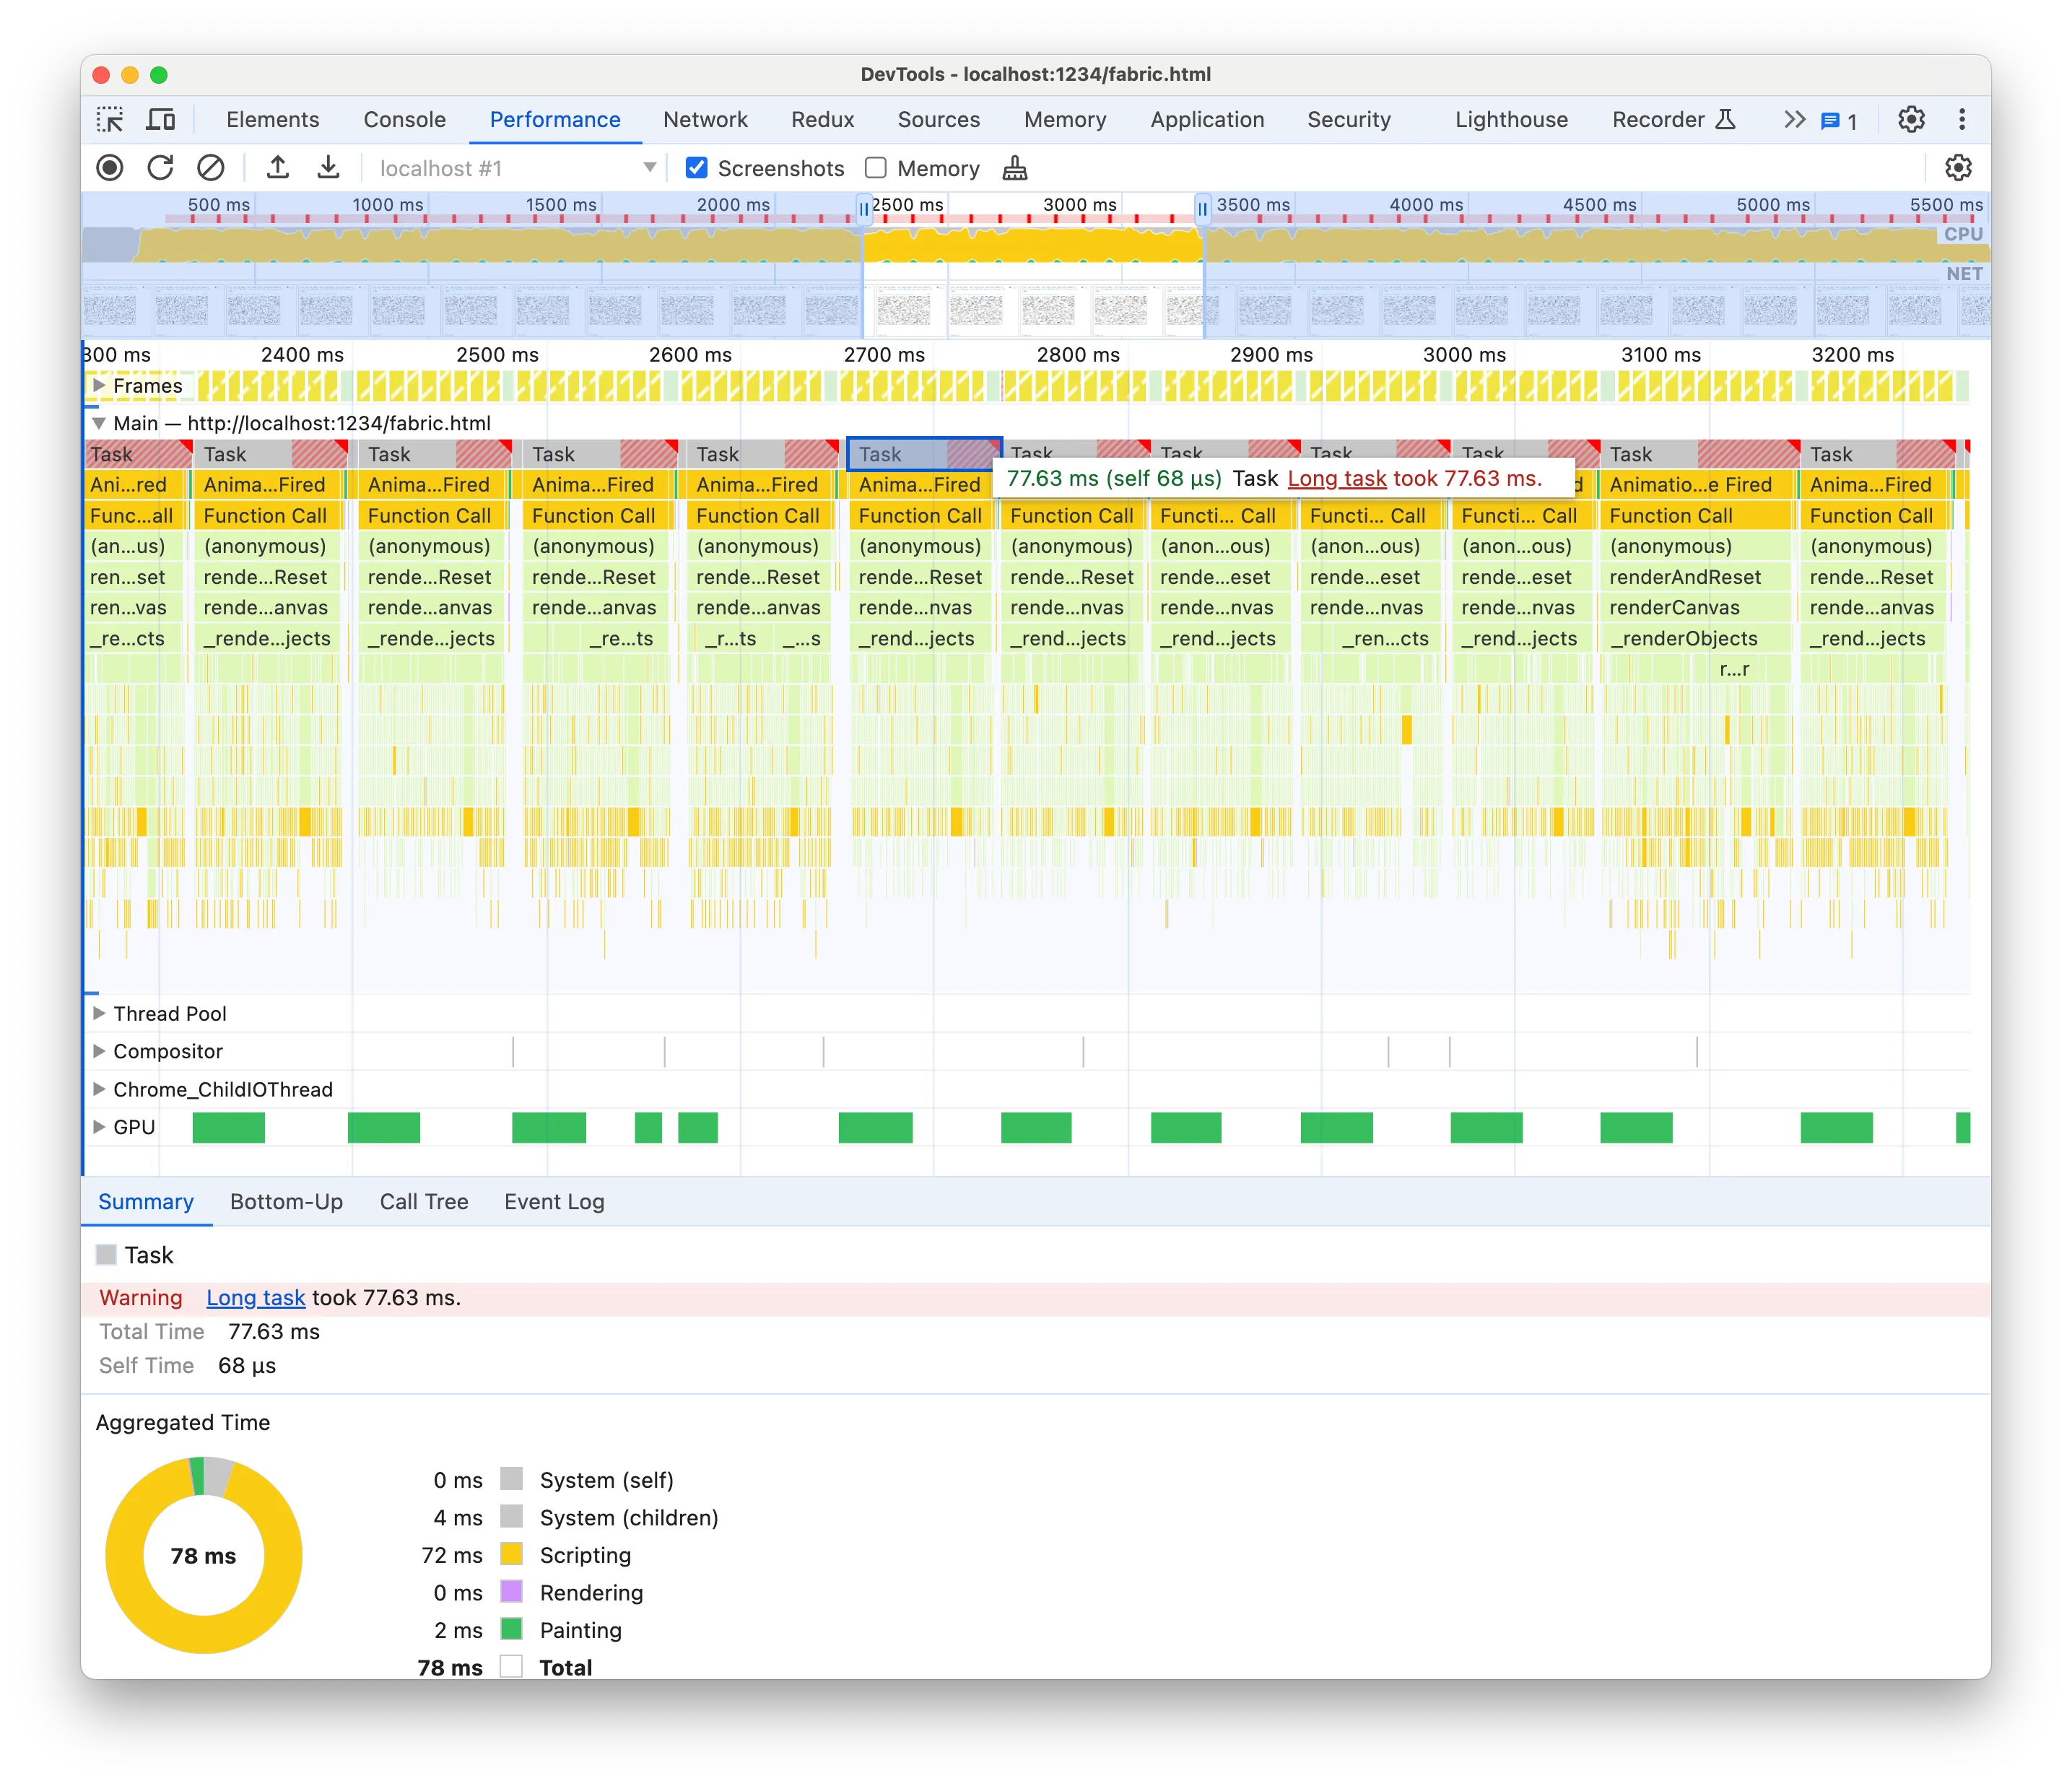
The Devtools are telling us again that each task is taking too long. We should not use more than 33ms if we want to reach 30fps, but each task is taking 77.63ms and that’s on a M2 Pro!
Clicking on the “Long task” link on the Summary will take us to the Chrome documentation where they suggest splitting the computation into async chunks. That’s not often possible or it’s an advanced optimisation that it’s highly application-specific. Not something you can accomplish in under two hours! For instance, in our case, updating asynchronously the rects while interleaving frame rendering would result in some rects’ positions not being updated or not being rendered. Splitting a computation into async chunks is no easy feat. More often, we need instead to reduce that synchronous computation and leave async chunking as the last advanced optimisation.
A nice addition of Chrome v122 is that we can even see the initiators of the event tasks, such as who called setTimeout or requestAnimationFrame. This is very convenient in case you wondering for instance “Why the hell this code is running”.
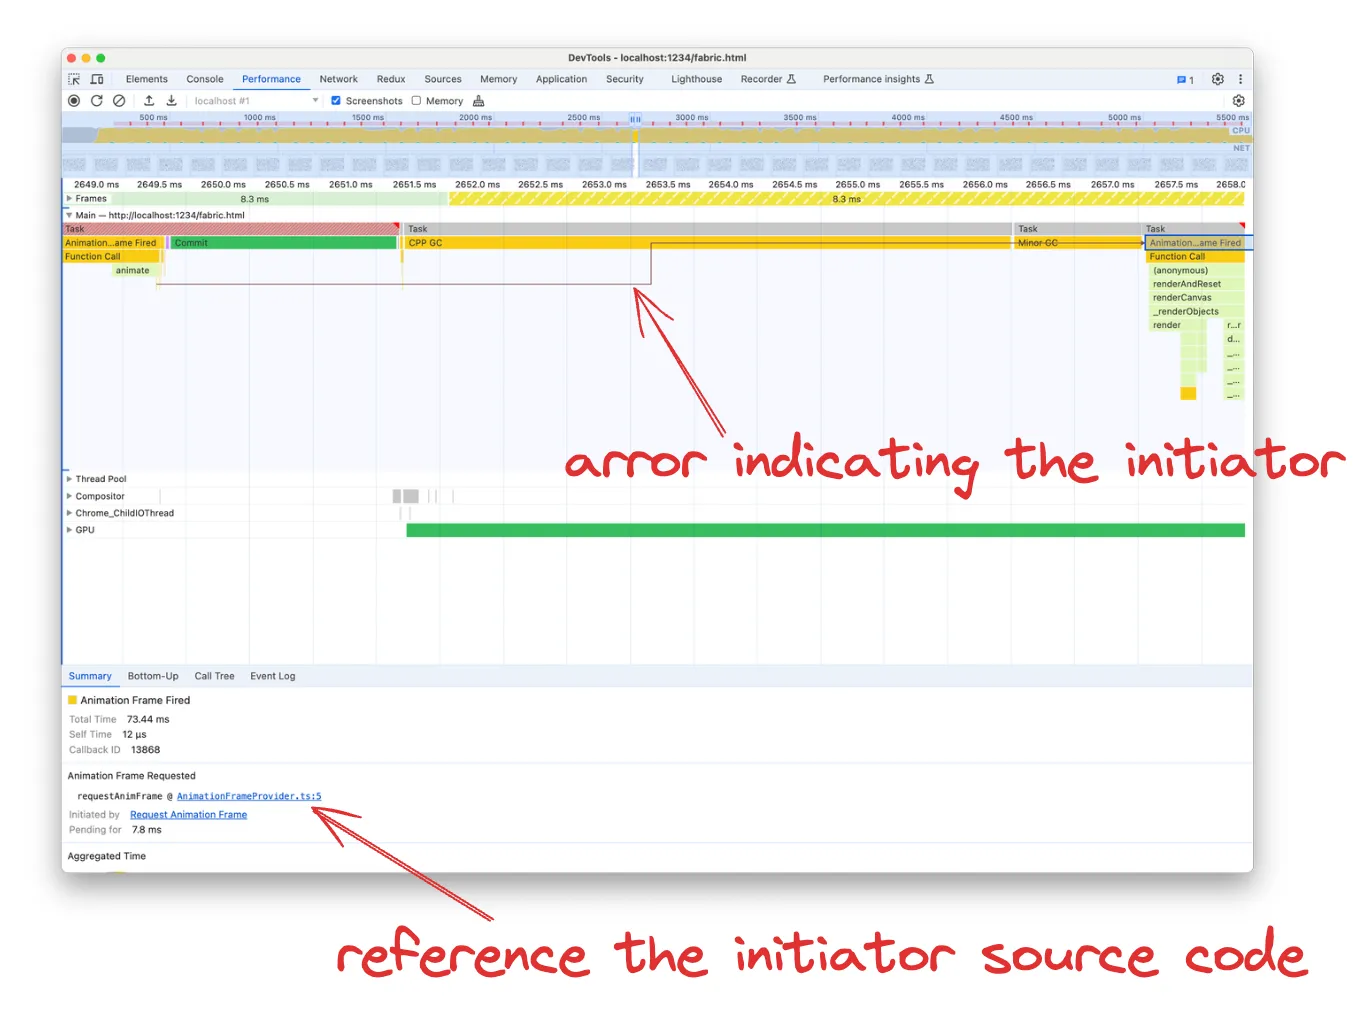
You can determine the initiator by either following back the arrow in the flame graph or opening the function Source in the Summary tab. I find following the arrow more useful, as the function reference takes to the exact function that called requestAnimationFrame, which in our case is just a wrapper:
import { getFabricWindow } from '../../env';
export function requestAnimFrame(callback: FrameRequestCallback): number {
return getFabricWindow().requestAnimationFrame(callback);
}
export function cancelAnimFrame(handle: number): void {
return getFabricWindow().cancelAnimationFrame(handle);
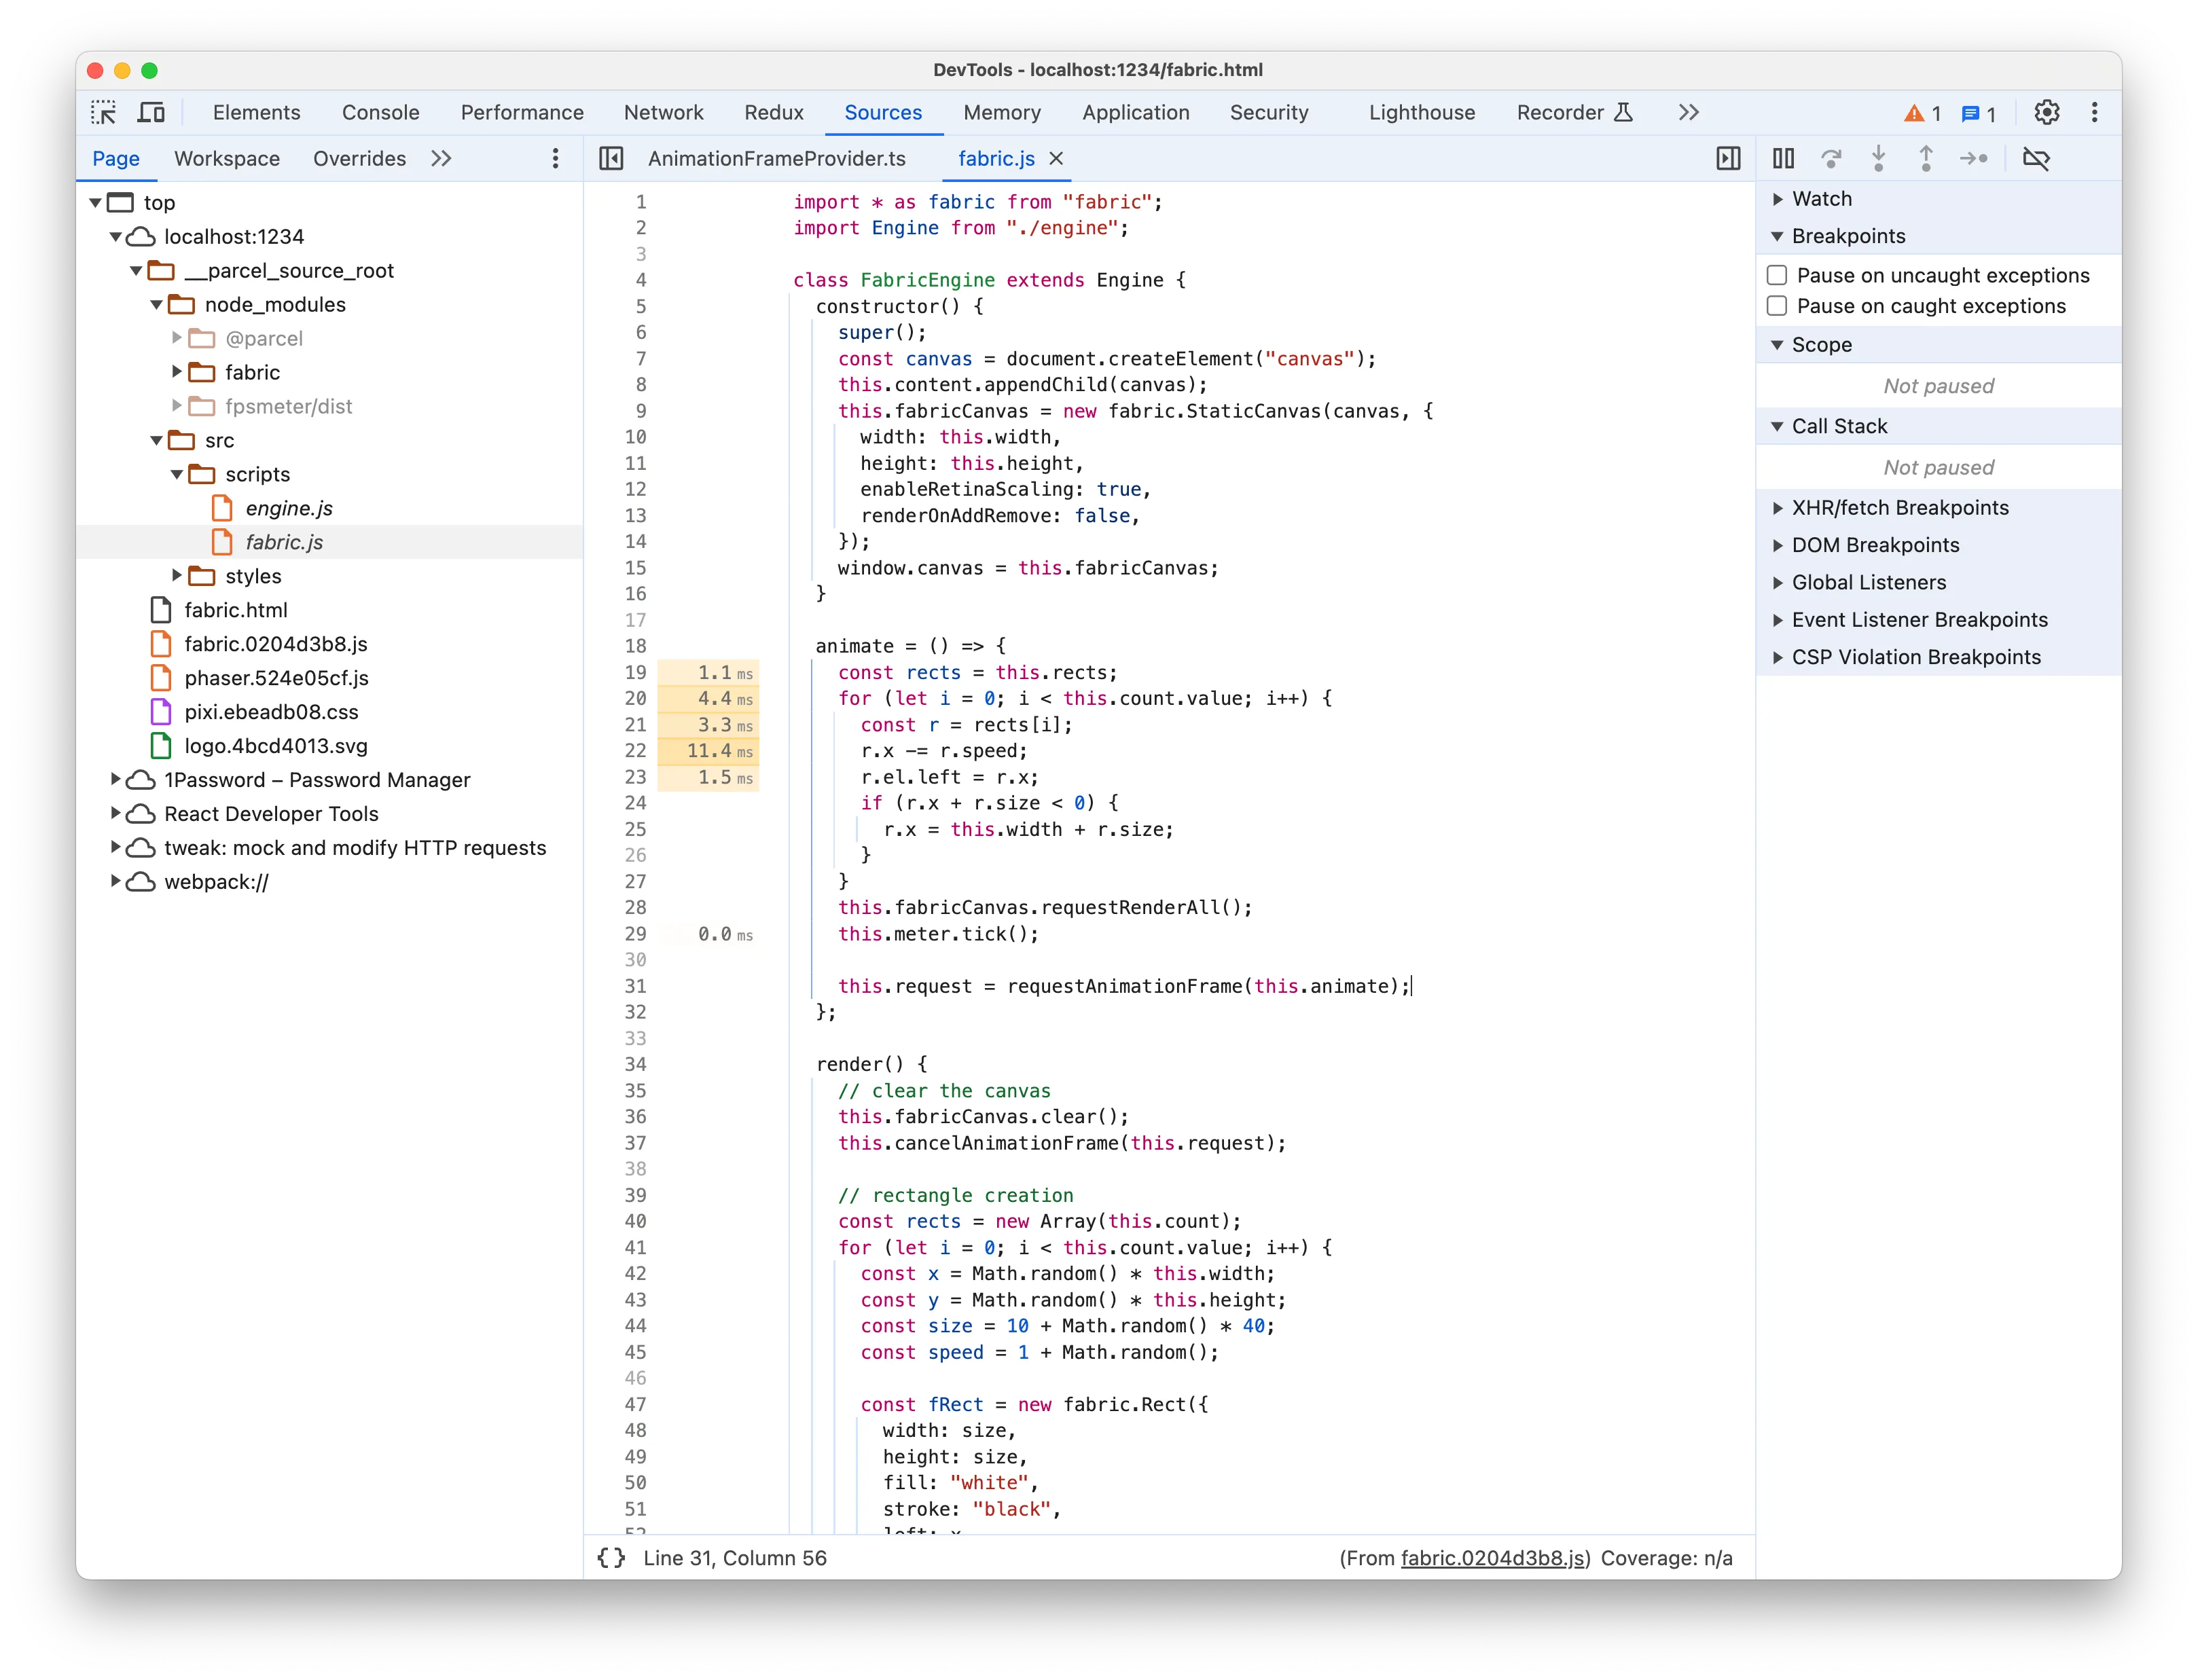
}That won’t tell us much about who and why it was called. If you followed instead the arrow in the flame graph you could see the parents in the call stack. It’s not a surprise that in our case the initiator it’s a function called animate, a fabric utility, which in turn is called by a generic Function call. That’s because we’re using an anonymous arrow function, but thankfully the Summary will provide a reference to the function Source:
animate = () => {
  const rects = this.rects;
  for (let i = 0; i < this.count.value; i++) {
    const r = rects[i];
    r.x -= r.speed;
    r.el.left = r.x;
    if (r.x + r.size < 0) {
      r.x = this.width + r.size;
    }
  }
  this.fabricCanvas.requestRenderAll();
  this.meter.tick();

  this.request = requestAnimationFrame(this.animate);
};
The function is called animate as well, but this time it’s the code responsible for updating the rects and asking fabric.js to re-render for each animation frame. Each line of code in the function will have a number label on the left, indicating the total time execution spent on the line for the whole recording.
While bigger values are coloured with a more intense yellow, it’s not indicative that there is something bad about that code. First, keep in mind that it’s the total time of the recording, so not per-function execution. Unless you see values greater than hundreds of ms for a recording of a few seconds, you should not worry at all. Second, it’s natural for some lines of code to take more than other lines and the difference accumulates over the executions, so you often see some lines have bigger label times. In our case it may seem to suggest that there is a problem with r.x -= r.speed but there’s nothing wrong with it of course.
So in my experience, evaluate carefully the time labels associated with the lines of code in the Source. They are often misleading you and you risk losing time following a wrong track.
Analysing the flame chart
Our goal is to reduce the execution time of each task in the flame chart. A key aspect of doing performance analysis is having first a good grasp of what the code is trying to accomplish. To do so, we first start by selecting a task and looking at the code flow information provided by the graph.
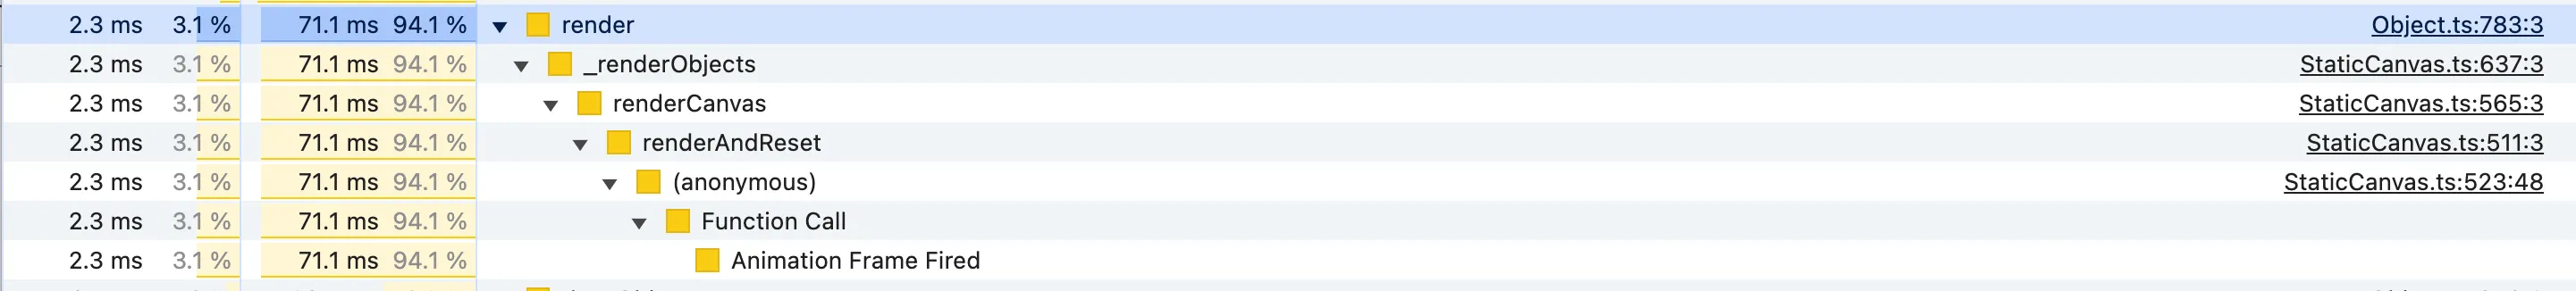
We can see that each task starts with the “Function Call” which we’ve seen is the animate method of the benchmark. Then we have a few method calls that lead to _renderObjects. You’ll notice that the nodes in the between and _renderObjects itself have the same width as the parent node. The width of a node in the flame graph corresponds to the percentage of the parent execution time, so a node that takes all the parent width means that we can ignore the parent and move forward on the code path.
For instance renderCanvas is a long method, but because the flame graph is showing us that _renderObjects takes all its execution time, we don’t need to investigate the other lines of code in the method:
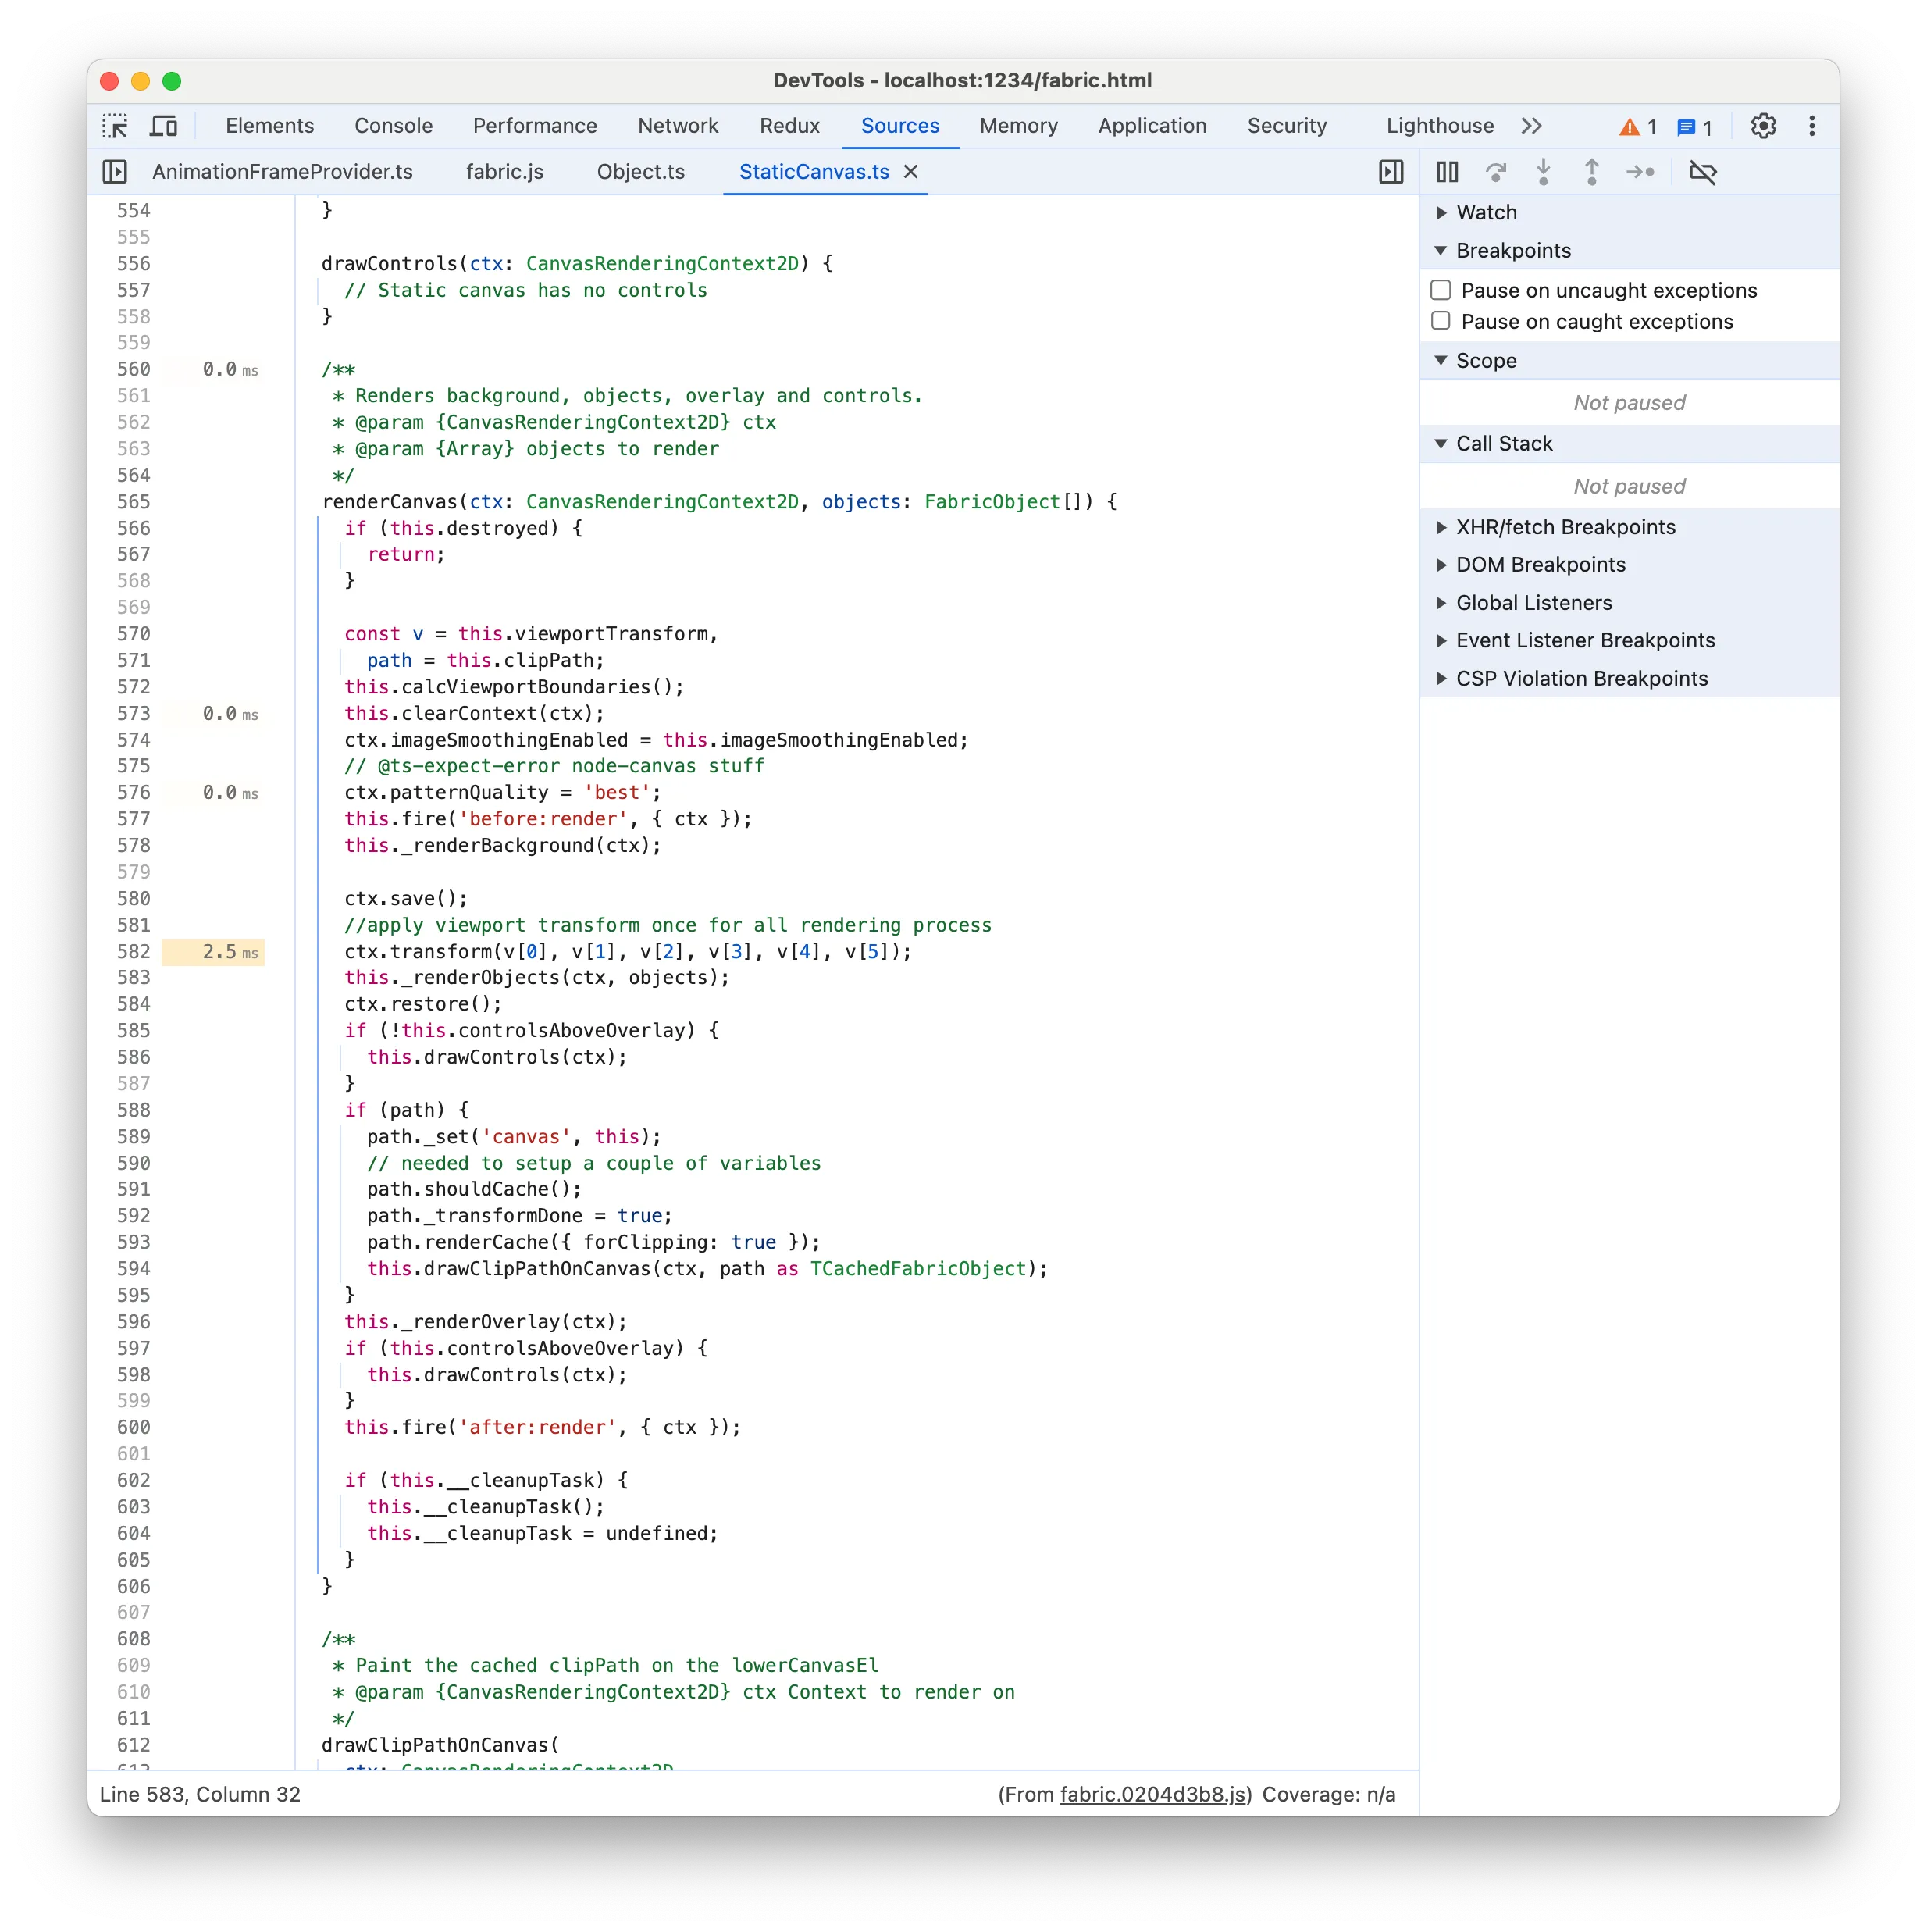
That’s why it’s important to be proficient at reading the flame graph, it saves lots of time! As you get used to working with the flame graph, you’ll naturally skip the nodes/functions whose children nodes take up most of the width. Be careful however not to always jump immediately at the leaf nodes of the flame graph, as you could miss functions that have a significant own execution time, i.e. that spend a good amount of time doing work such as loops.
Moving on, we can see that _renderObjects has several children nodes called render, comprising the totality of _renderObjects’ execution time. That’s easily explained by looking at its source code:
_renderObjects(ctx: CanvasRenderingContext2D, objects: FabricObject[]) {
  for (let i = 0, len = objects.length; i < len; ++i) {
    objects[i] && objects[i].render(ctx);
  }
}
All it does is call objects[i].render(ctx) for each object on the canvas.
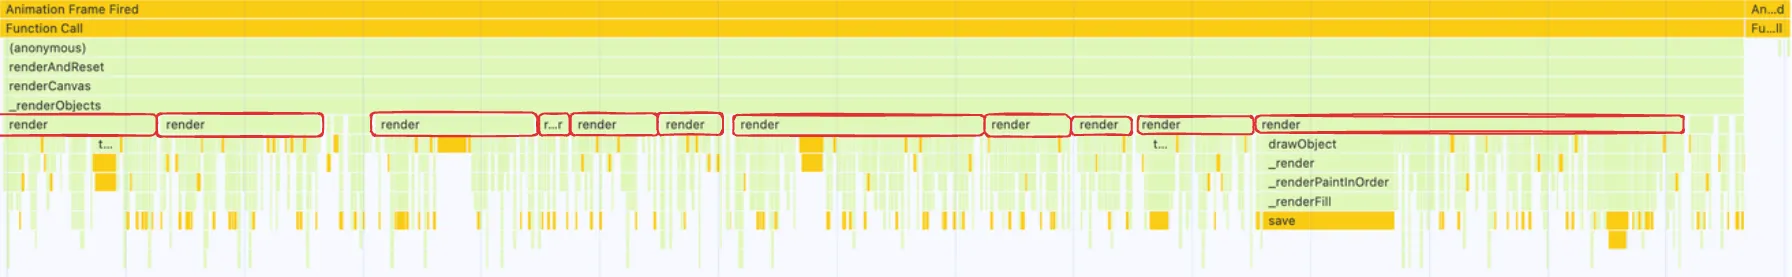
The flame graph will show us different children nodes called render, most of them will have the same width, but some may be wider or more narrow. The number of render nodes does not correspond to the actual times they have been executed (once per rect in our benchmark). The function nodes are batched and the flame graph shows us the execution time of each batch.
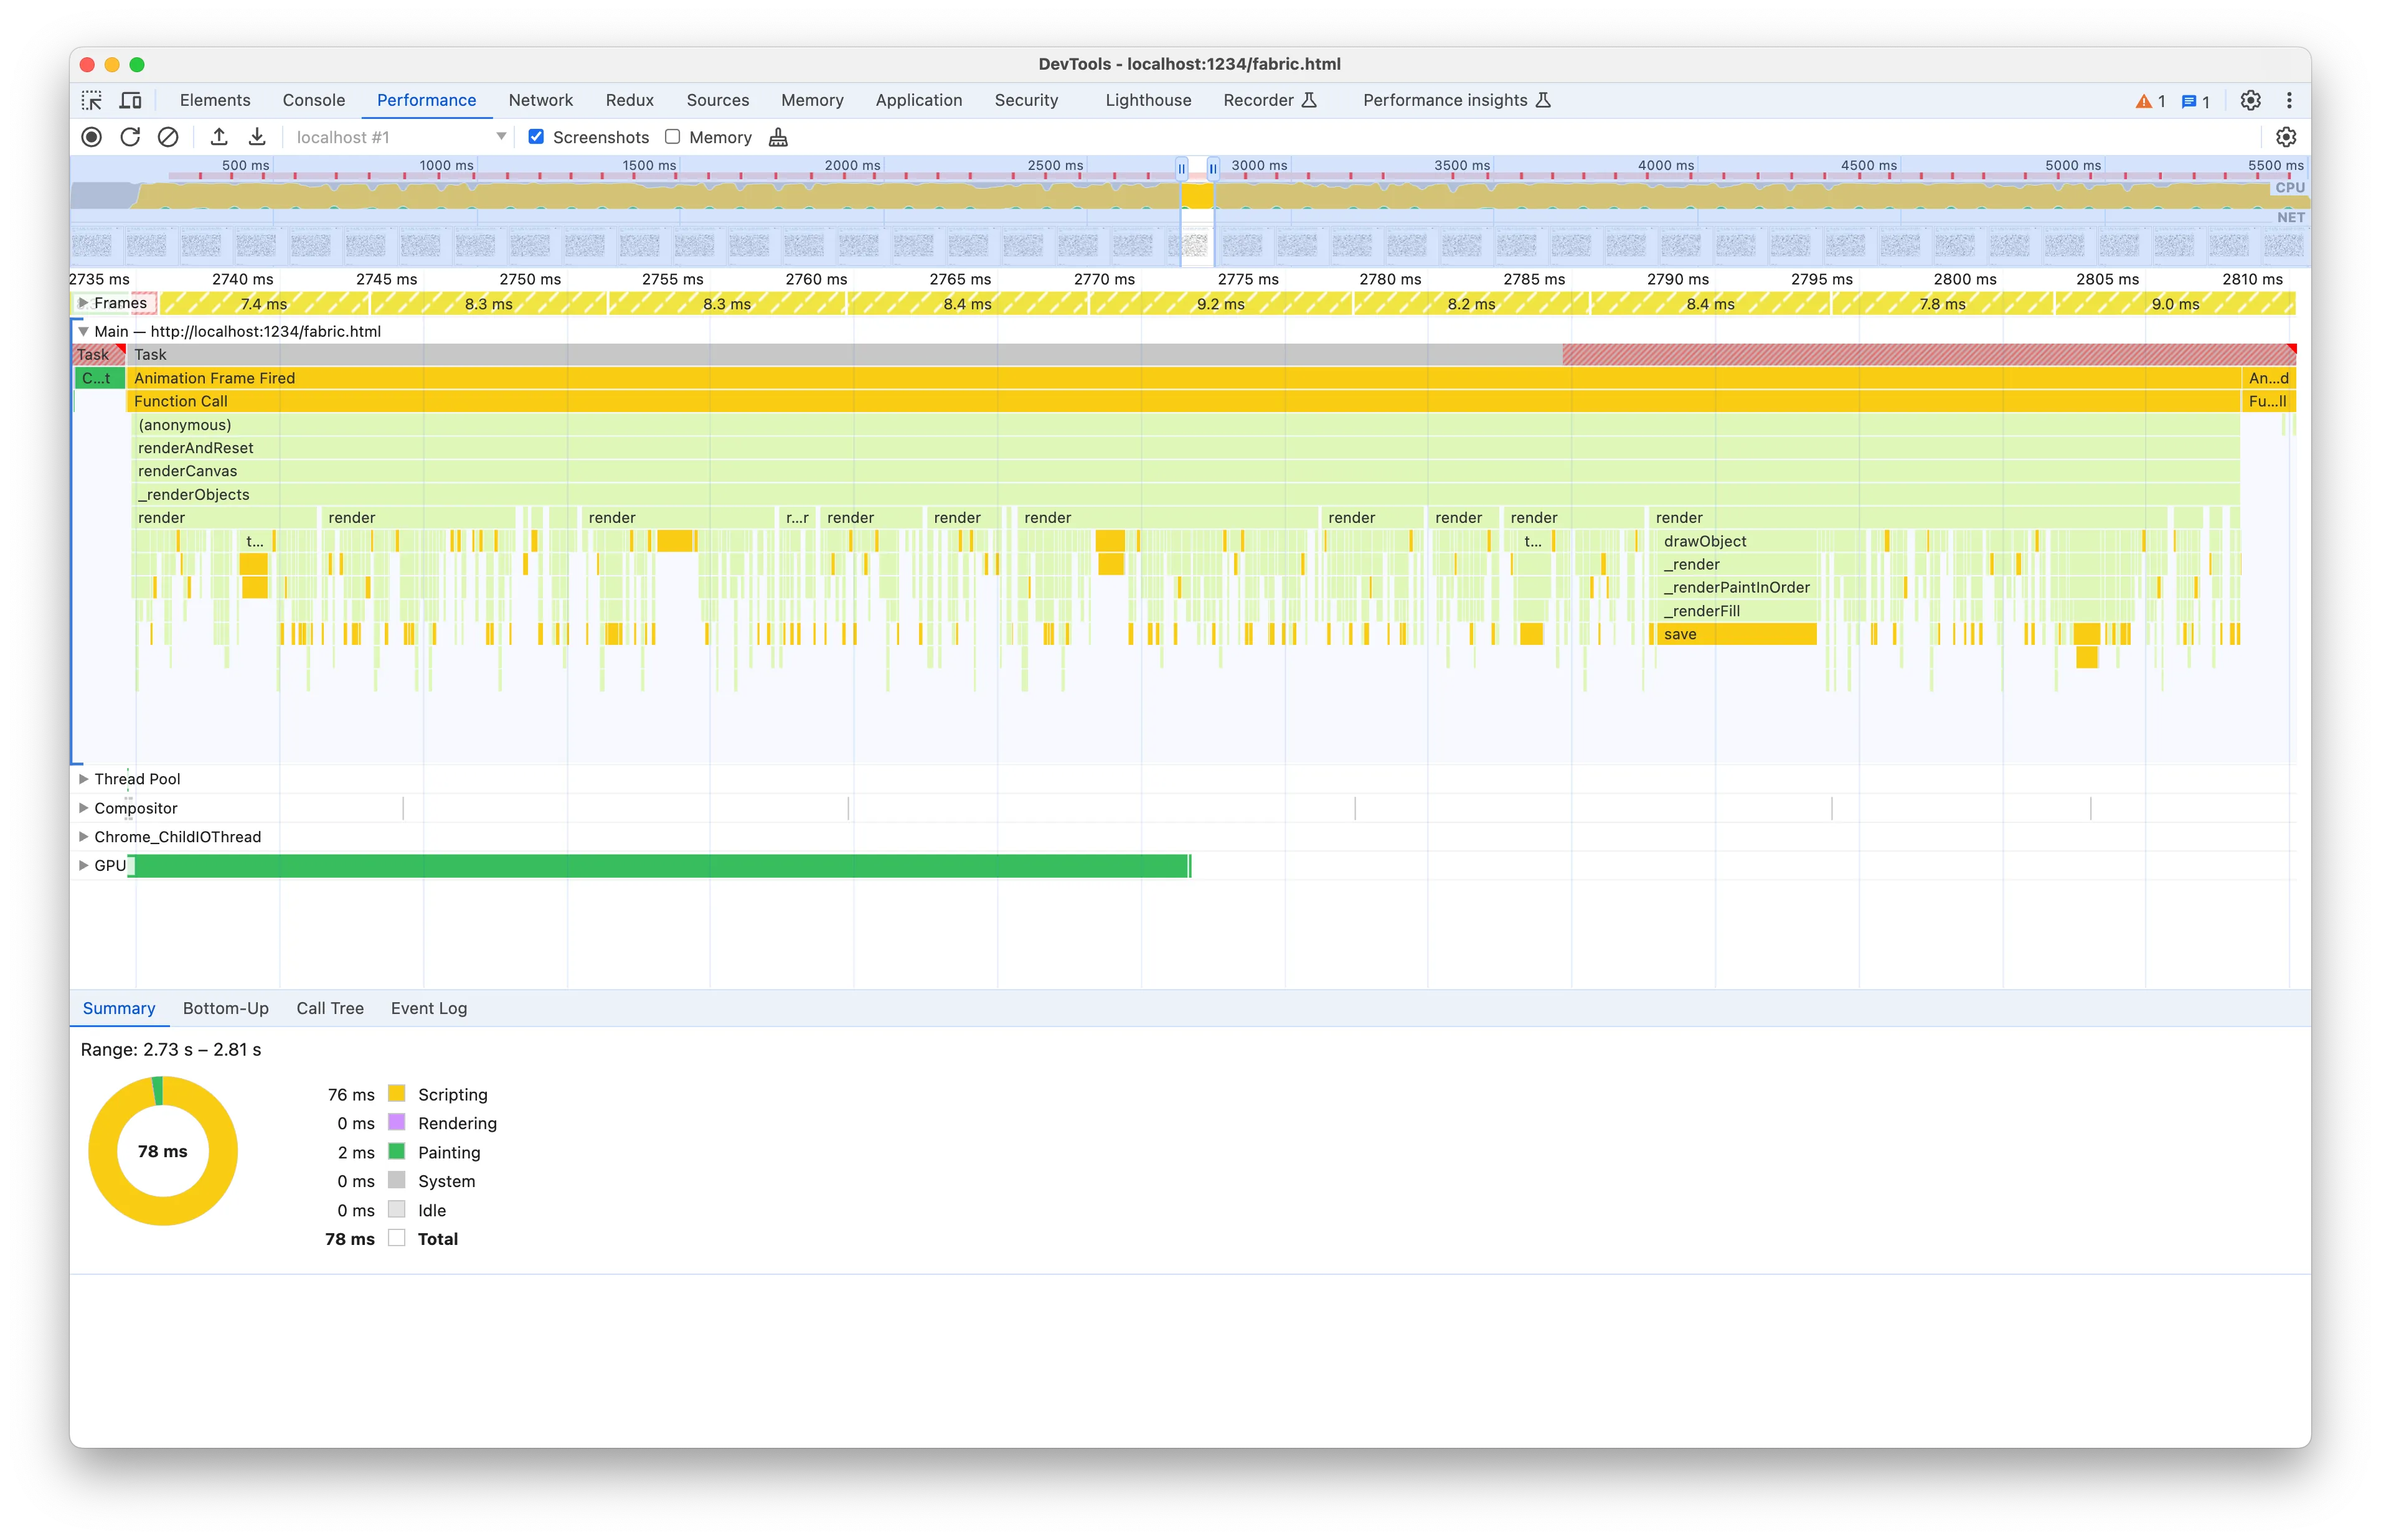
We can thus select any sibling node and look at the juicy render function:
The render method is responsible for rendering each object, specifically, each rect in our benchmark. Compared to the parent methods, its children nodes are significantly more diverse and there are so many of them that I can’t fit all their function names into a single screenshot! Let’s have a look at the source code:
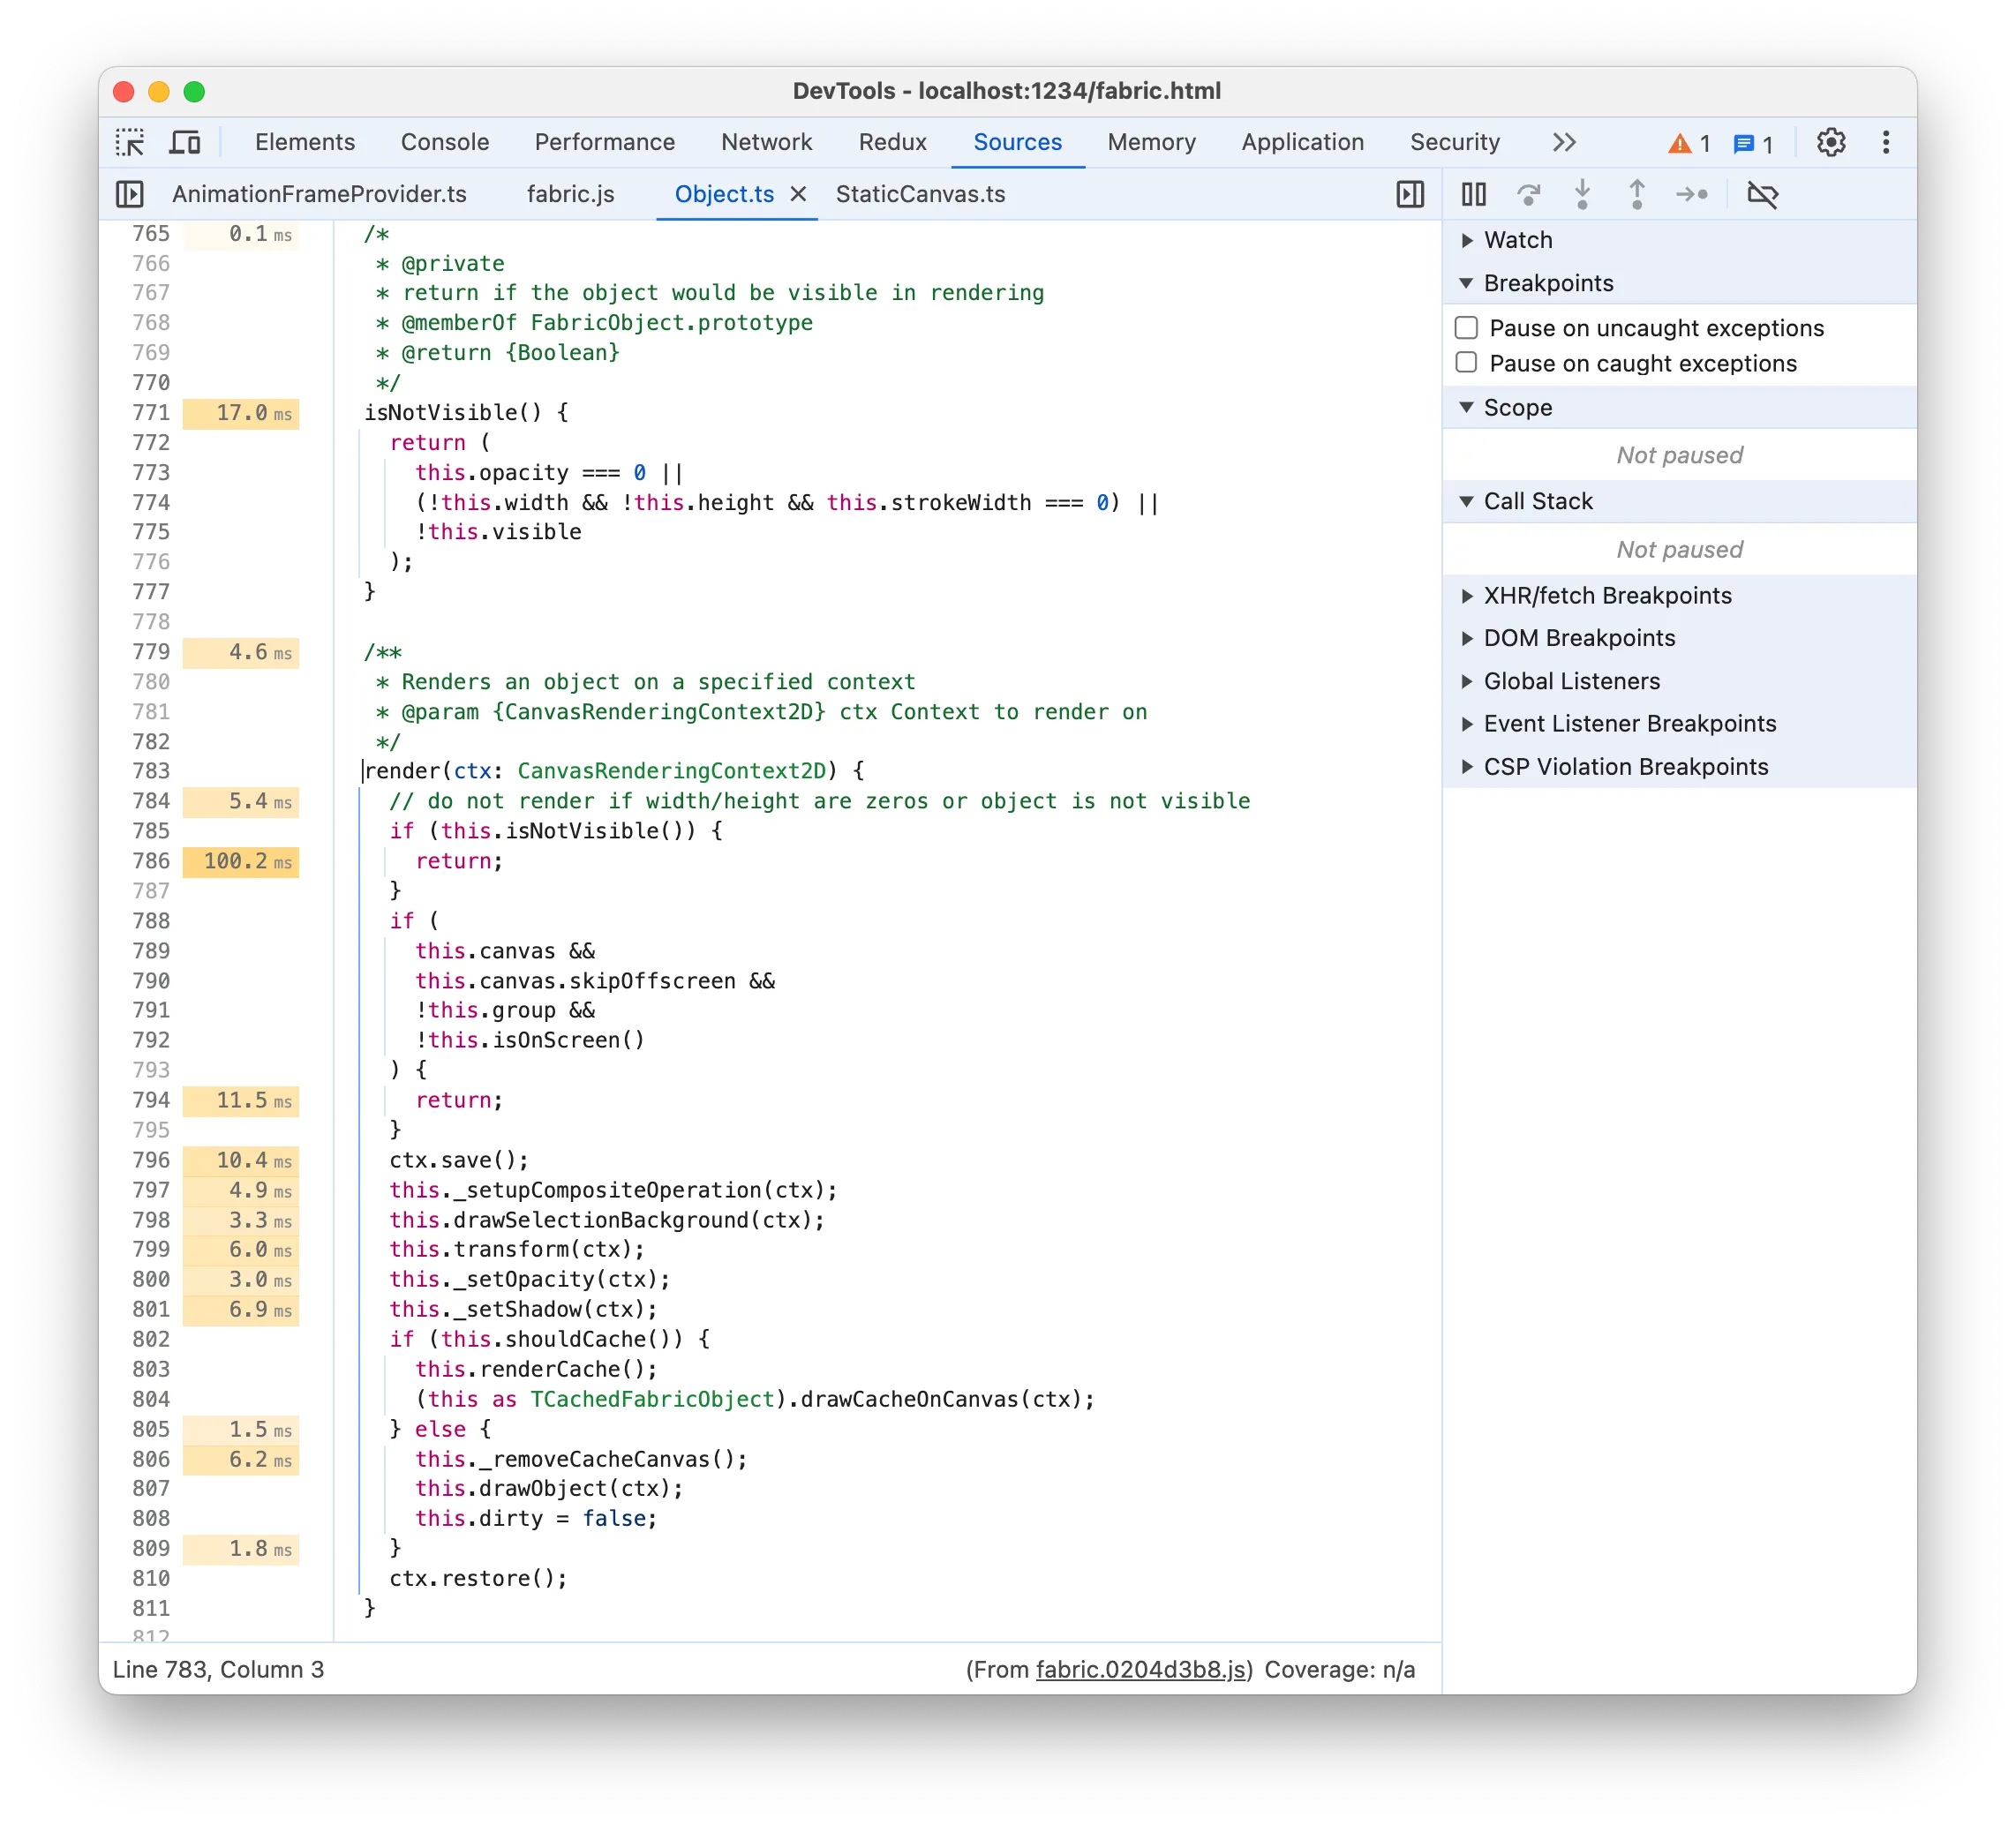
If you look at the time labels on the left you’ll notice something very weird, that is it seems to suggest that doing an early return is taking 100ms! I think there’s a long-standing bug in Chrome where the placement of the time labels is not accurate. I think in this case the time labels are offset by roughly one statement and the 100ms correspond to the if block, where the !this.isOnScreen() check is potentially expensive. If we go back to the flame chart, however, we often don’t see any isOnScreen node as a child of render, meaning that it’s not actually that significant. And when we do find it under some render node, it’s just a small node:
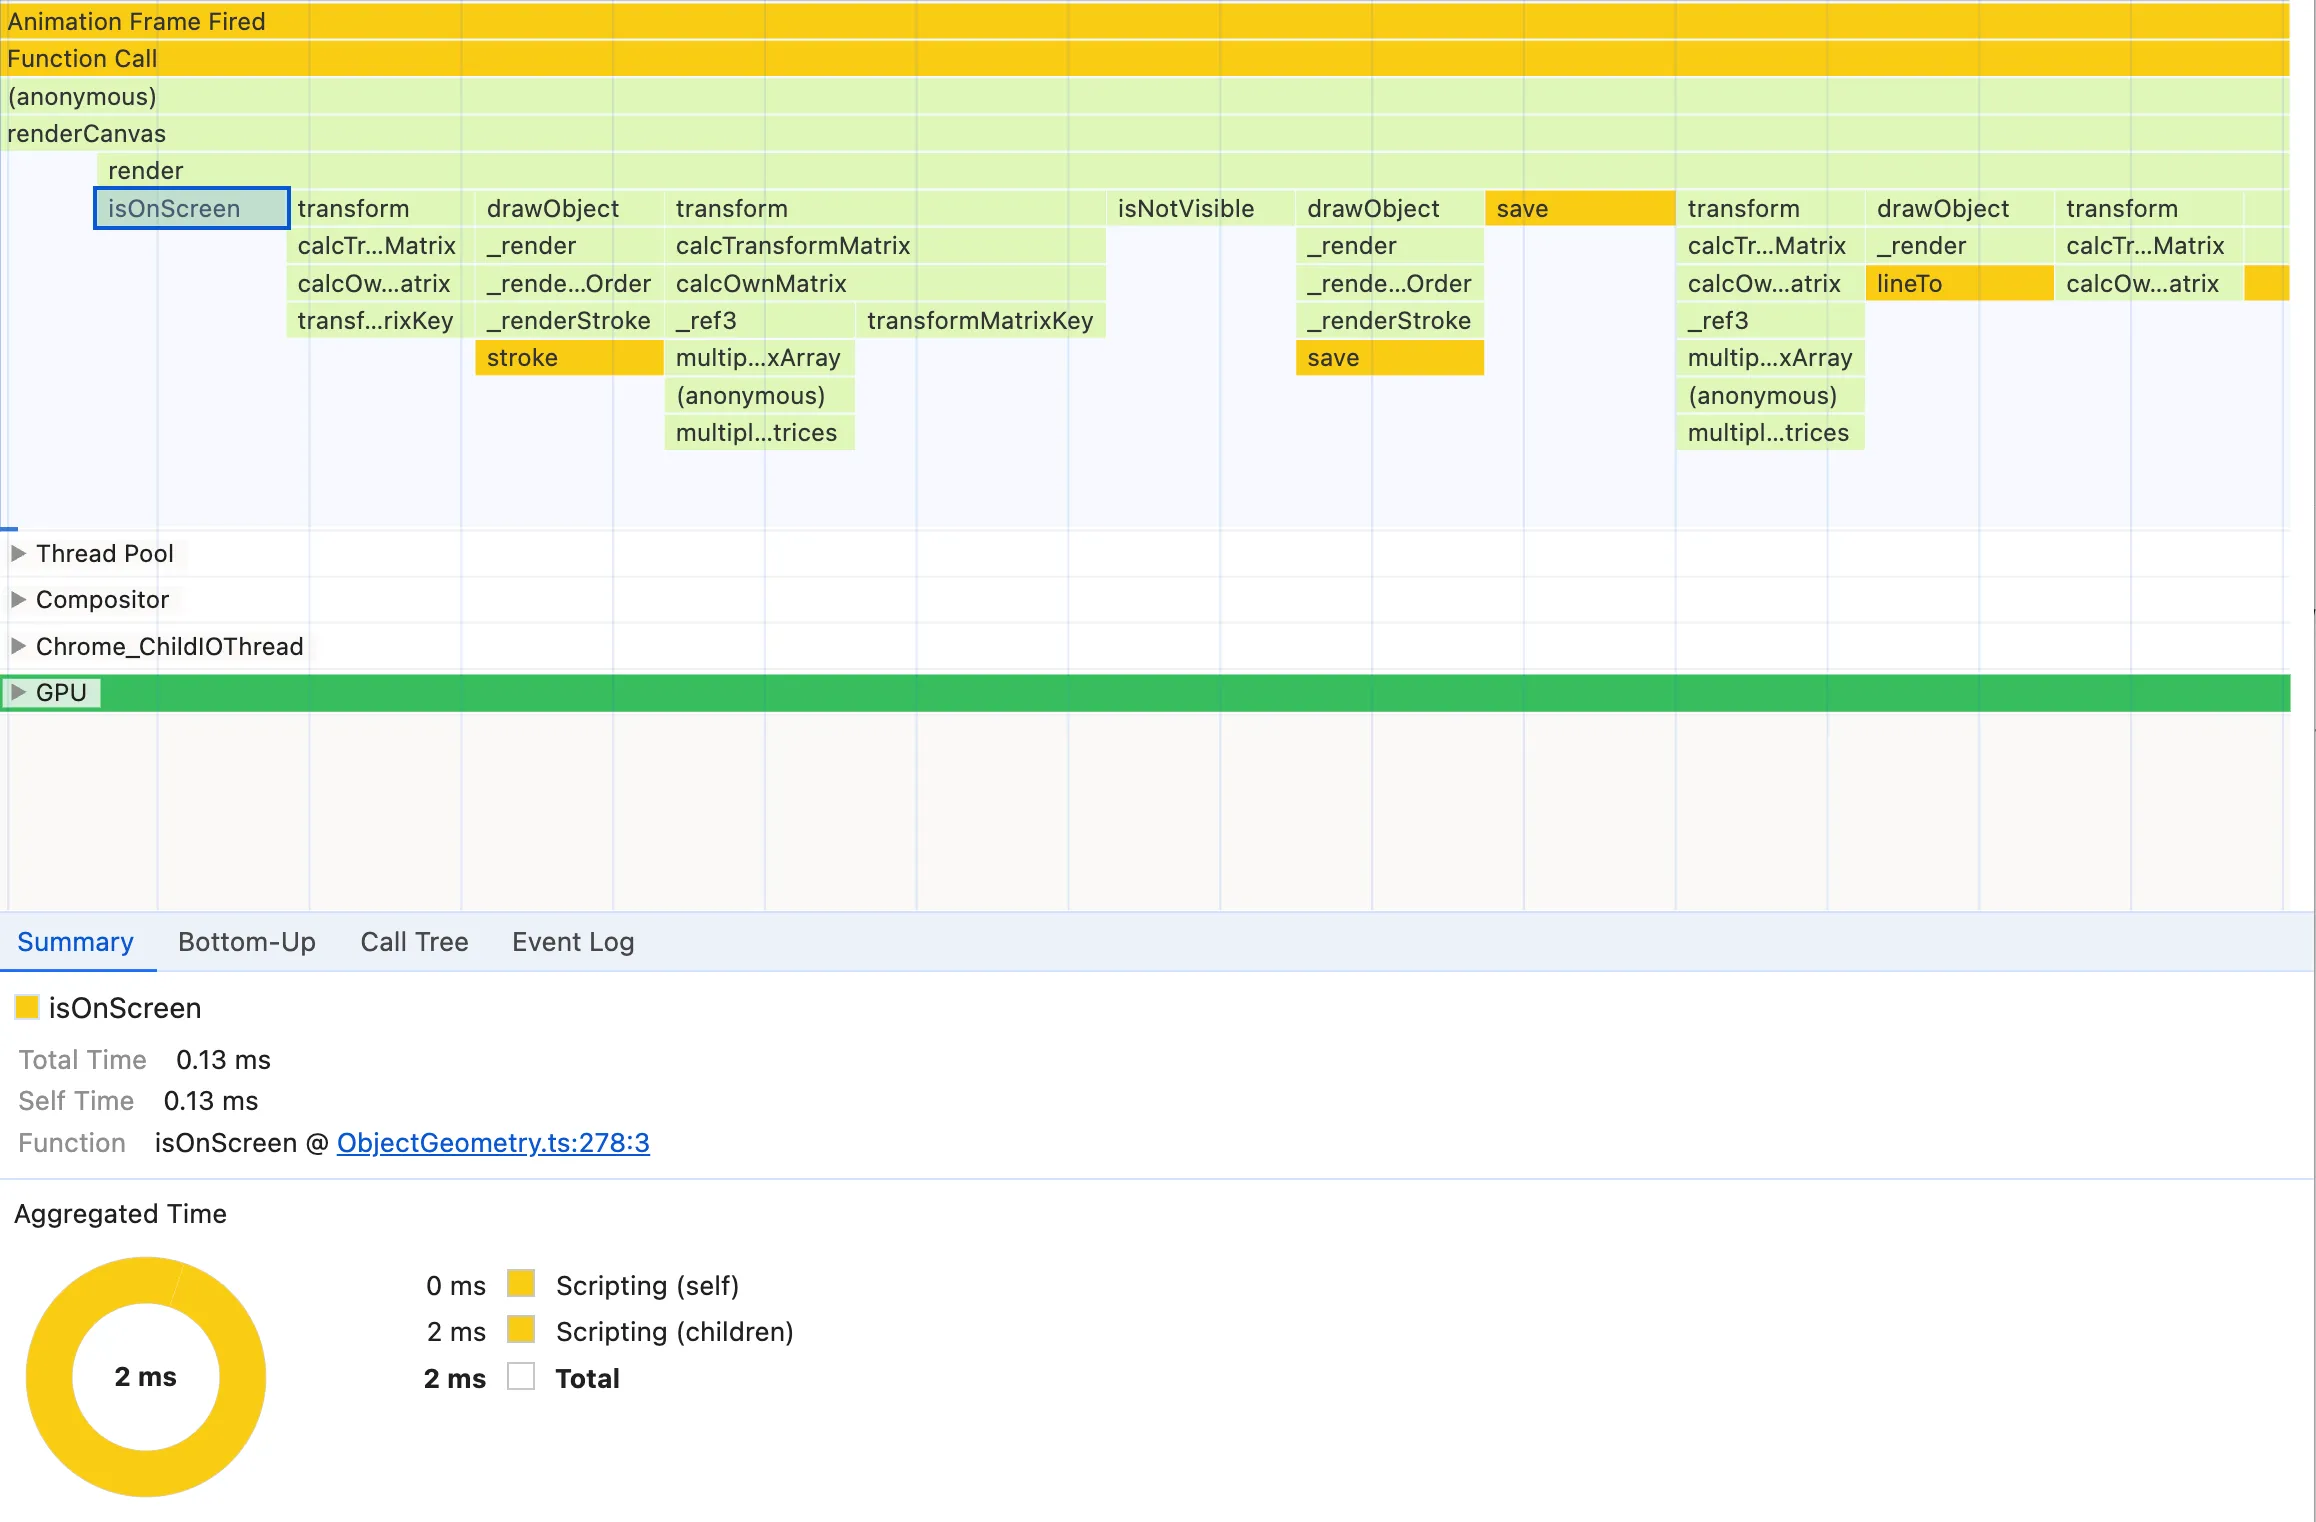
We can prove it’s not that significant by changing the render method to exclude checking for isOnScreen, since all our objects are on screen and animated. We save and record Performance again:
- the page FPS meter now reaches 14fps (it was 12fps before)
- each Task in the Flame chart is around 68ms now (it was 78ms before)
That’s roughly a ~15% improvement, which is not bad at all but far from what one might have expected from the huge time-label number in the Source panel. That’s why I don’t fully trust the time labels on the Source panel and it’s important to master reading the flame graph instead. While it’s a good improvement and we’ll apply it later, we were misled into thinking that isOnScreen was the main culprit, whereas as we’ll find out later there are more effective targets. Especially with complex codes like canvas or game rendering, focusing your energies on improving the wrong code can be very time-consuming. In our case, we could just delete the check knowing our specific case, but typically you would spend hours into thinking and experimenting on how to make isOnScreen more efficient.
The rest of the time labels are consistent with the flame graph information: there are several function calls that take a bit of code, and some take a bit more but none of them are outstandingly more expensive than the others.
Flame chart patterns
Back to the flame chart of render, we typically want to look for these kind of patterns when investigating a flame chart:
- Single children nodes significantly larger than others, indicating that for instance
renderis spending most of its time executing that function node - Nodes that repeat very frequently. While every single node doesn’t take much time, we can suffer from the famous “death by thousand cuts” if we’re running inefficient loops
Based on these patterns, a few nodes catch our eye.
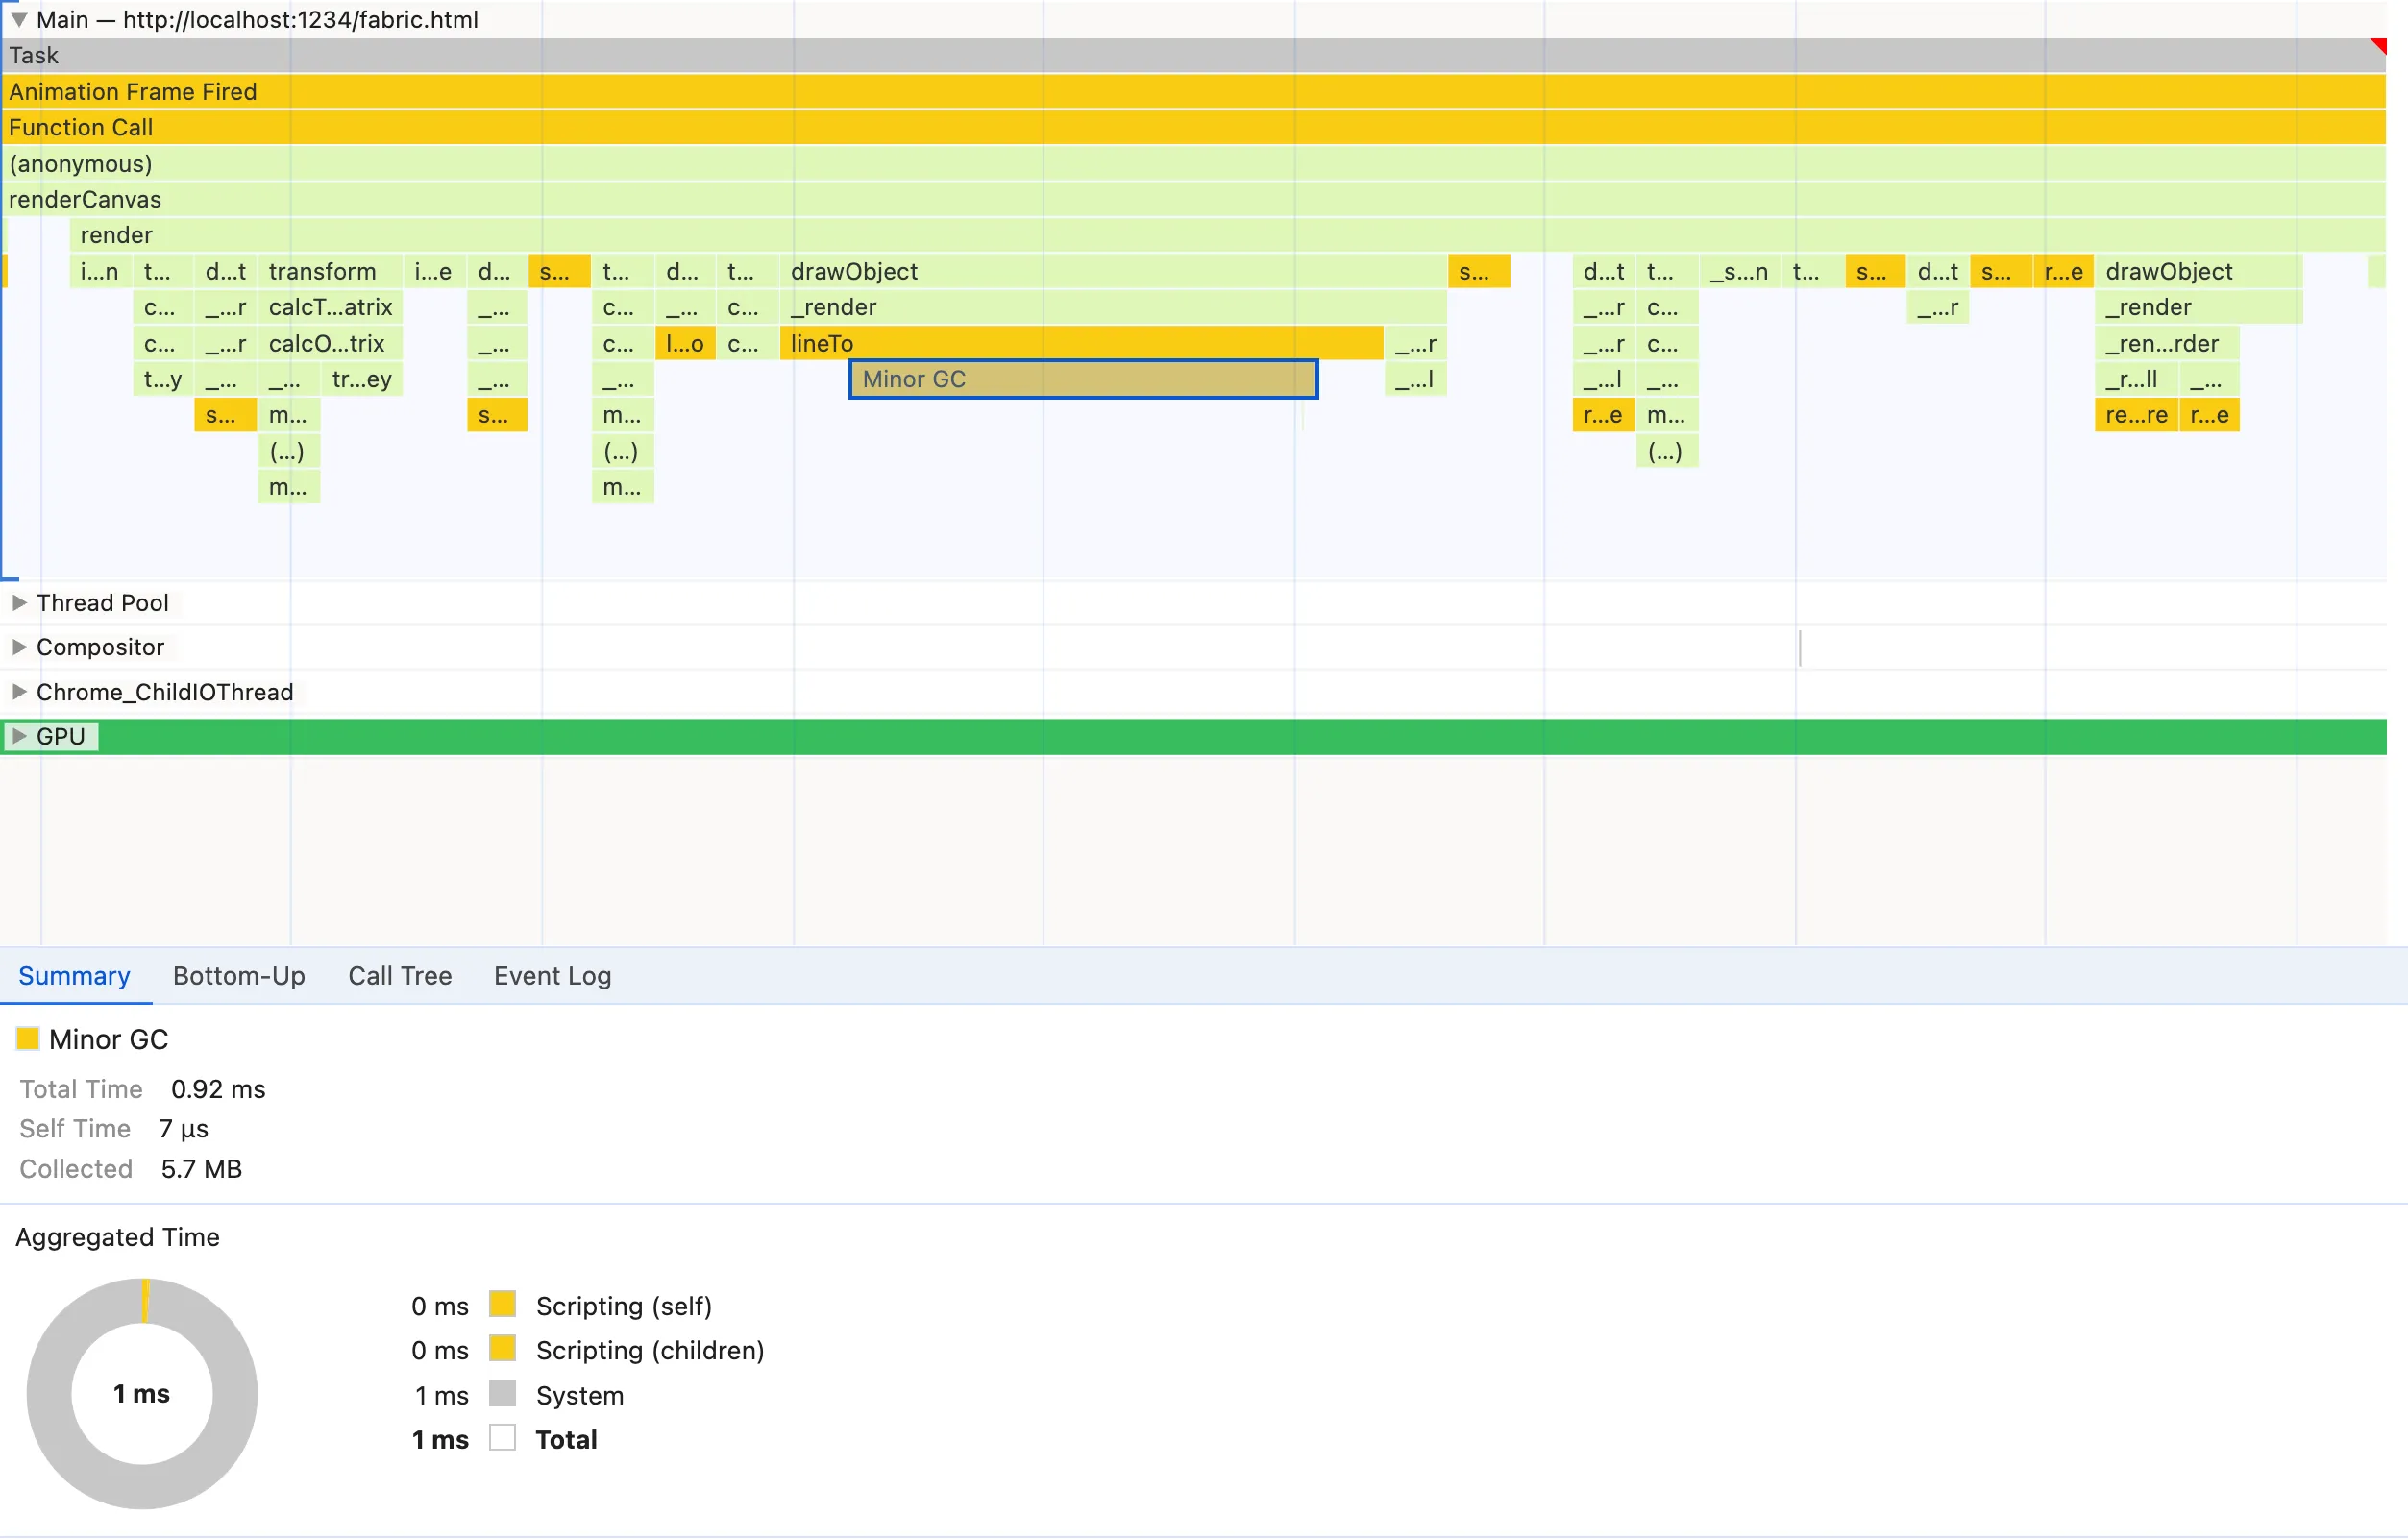
Occasionally, but frequently enough to be noticeable in the flame chart, a Minor GC (Garbage Collection) node appears and it’s significantly larger than the other nodes so it satisfies pattern #1. Each GC node means that the JavaScript engine deemed necessary to clean up the memory and that comes at a cost. Garbage collection makes the runtime execution time less predictable as its scheduling is not deterministic. We don’t know when it will run and how much it will take, resulting in more execution time and inconsistent frame rates.
An important and confusing note about the Minor GC nodes in the flame chart is that they can mislead you into thinking that the parent node is responsible for bad memory management.
For a long time, I was tricked by it as well. In our screenshot, we’d think that lineTo is the culprit but how is that possible since lineTo is a native CanvasRenderingContext2D method! The truth is that the flame chart will show you when something happens, so if the Garbage Collection happens during the execution of lineTo, it will appear as its child. The collected memory has been allocated however by a completely different function, which may not even be in the flame chart if it’s not that CPU expensive.
Detecting the root cause of the inefficient memory allocations that result in expensive unpredictable Garbage Collection is unfortunately out of the scope of this article. We’ll talk more about memory management and analysis in a dedicated future article, but luckily for us, the problem will be solved by addressing a CPU-intensive function later. A function in our code is responsible for both inefficient CPU execution and memory management, so solving one problem fixes the other one as well.
Nodes with save, restore, fill and lineTo seem to appear very frequently so they satisfy instead pattern #2. It’s clear that using them has some cost and the calls are very frequent, but it’s hard to tell if there’s any possible action here. They are native CanvasRenderingContext2D so we can’t inspect them to see the implementation to gather more information about what we could improve. So let’s move on for now.
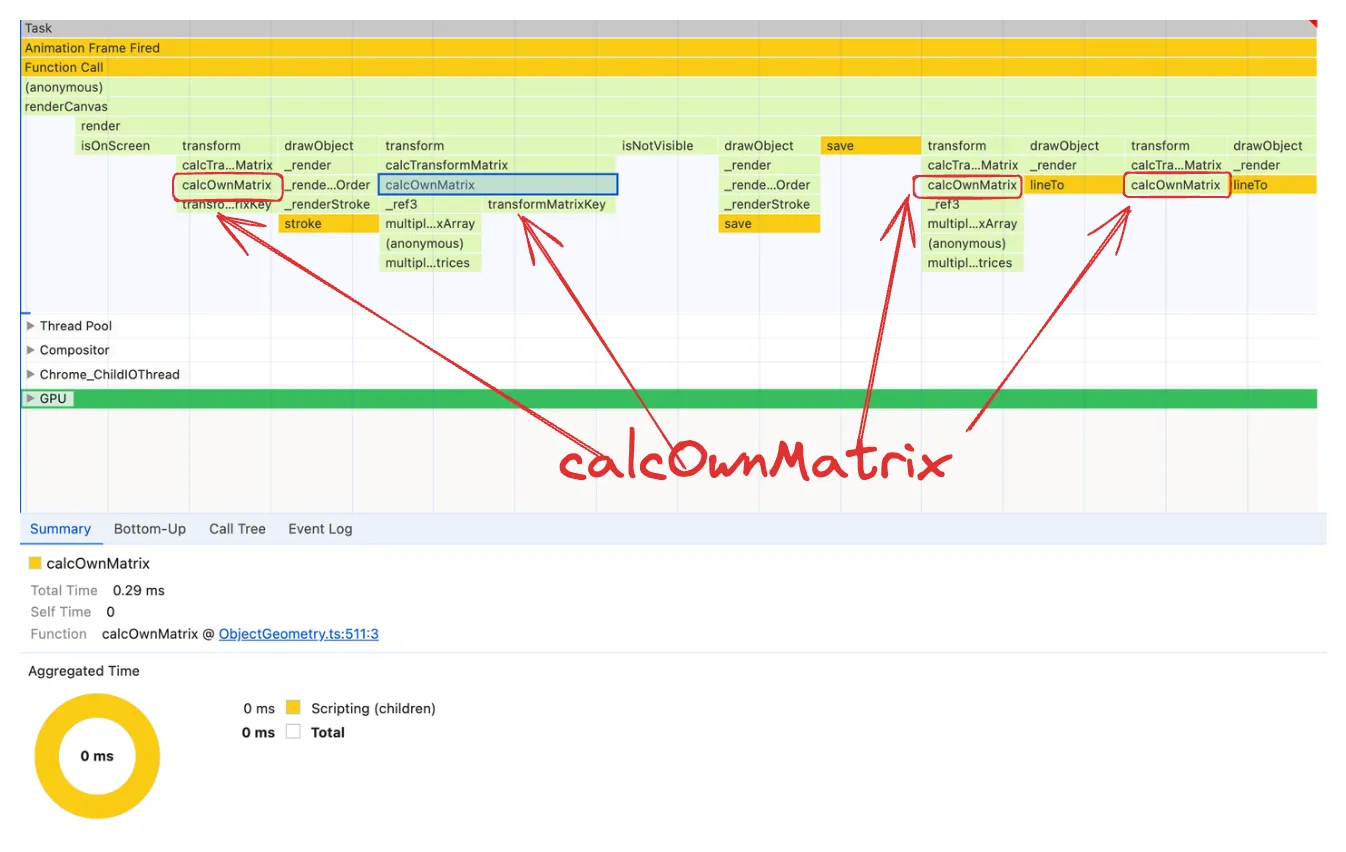
calcOwnMatrix is a node that appears frequently in the flame chart and it takes also a good chunk of the execution time, so it satisfies both flame chart patterns we want to look for. As we’ll see it’s indeed a very good candidate, but it’s once again too hard to tell exactly if there’s anything wrong with it. An additional doubt is whether there is some issue with calcOwnMatrix or its children nodes transformMatrixKey and multiplyTransformMatrices as sometimes they appear as children nodes and as large as calcOwnMatrix itself.
So the flame chart analysis has given us some hints on where to look for further investigation but it would be nice if we could get more direction. What we would like is to have numbers. When working with performance analysis, it’s critical to make decisions based on numbers. The Bottom-Up panel will help us with that.
Bottom-Up analysis
The Bottom-Up panel contains all the functions called within the selected timeline range or selected flame graph node. Then we can either sort them by Self Time (aggregated own execution time) or Total time (aggregated own execution time + internally called functions’ execution time). By “aggregated” we mean the sum within the selected Timeline range or Flame chart node. The reason the panel is called Bottom-Up is that we can see the bottom-up call stack of each function if we expand it. This is useful to determine why an expensive function was called:
In order however to analyse the Bottom-Up panel for the render function, we have to do something a bit unintuitive: select the renderCanvas node in the flame graph instead. The reason is that, as we have noticed, the render function nodes in the flame graph are not consistent. They have different widths/durations and depending on which specific node you select you’ll see different functions and execution times being displayed in the Bottom-Up panel.
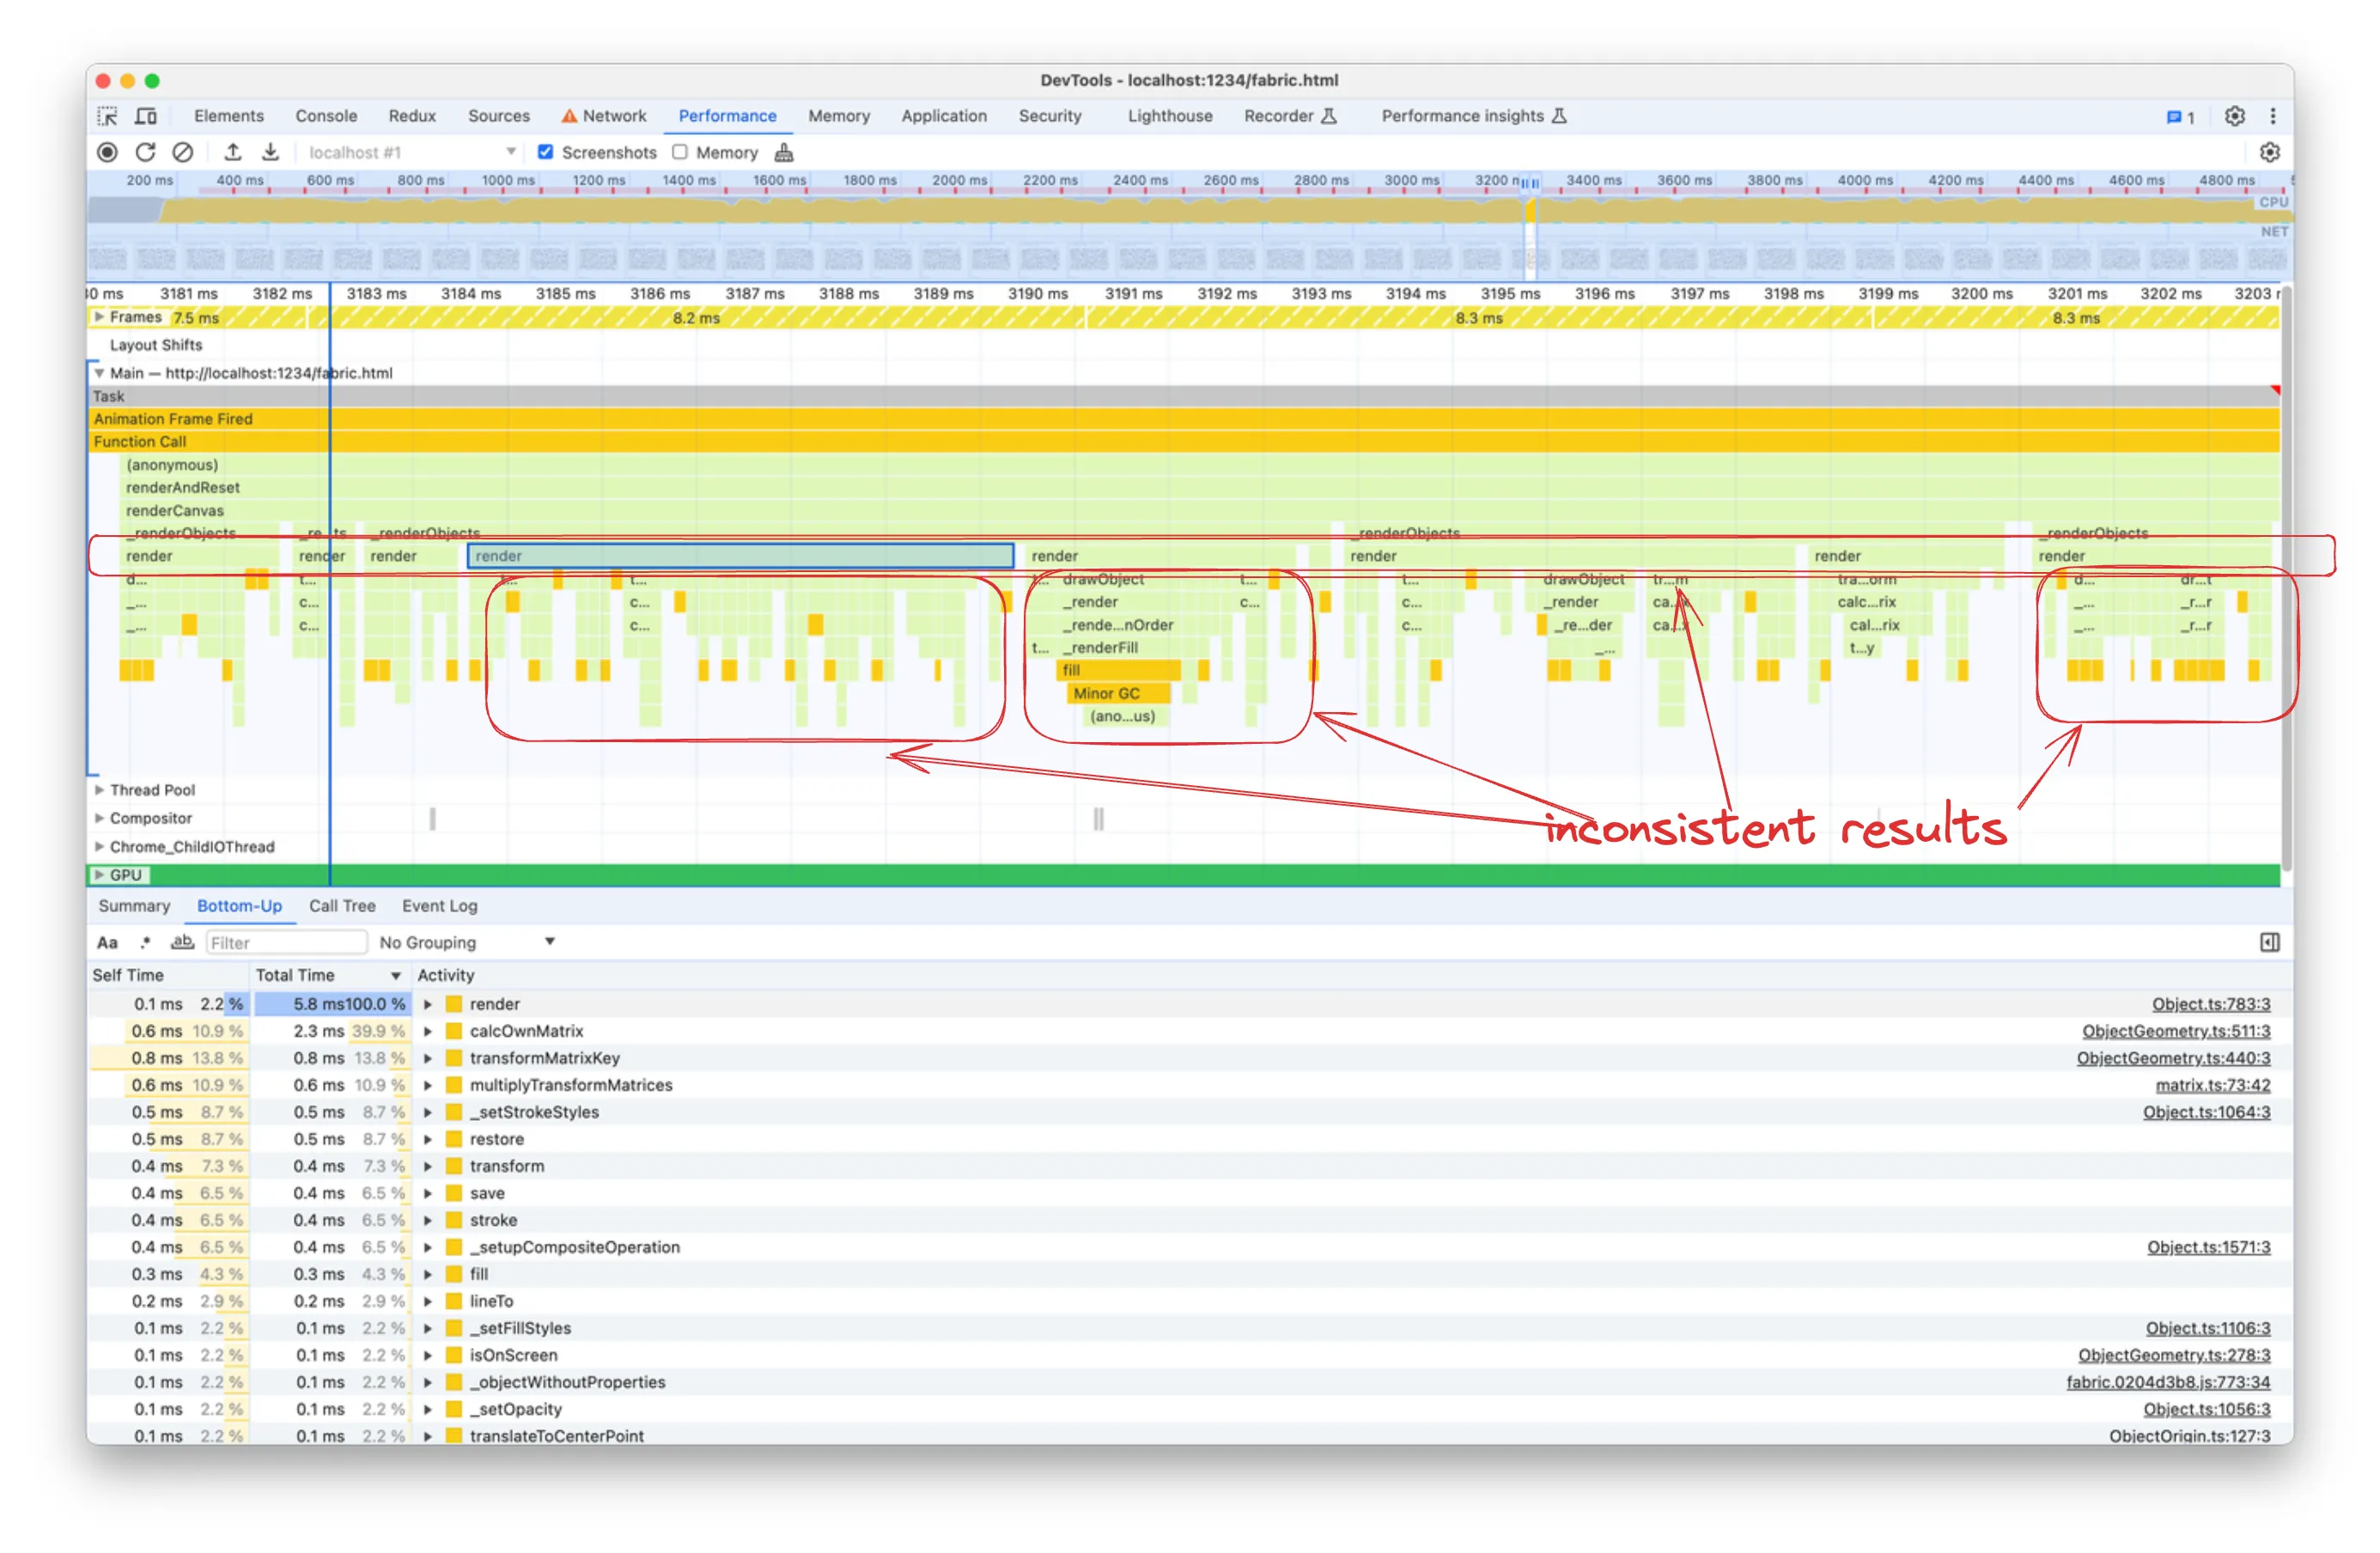
When picking the flame chart node to analyse, it’s easier to work with bigger aggregated times and more consistent nodes.
You’ll notice that with renderCanvas we have far more consistent durations and Bottom-Up lists.
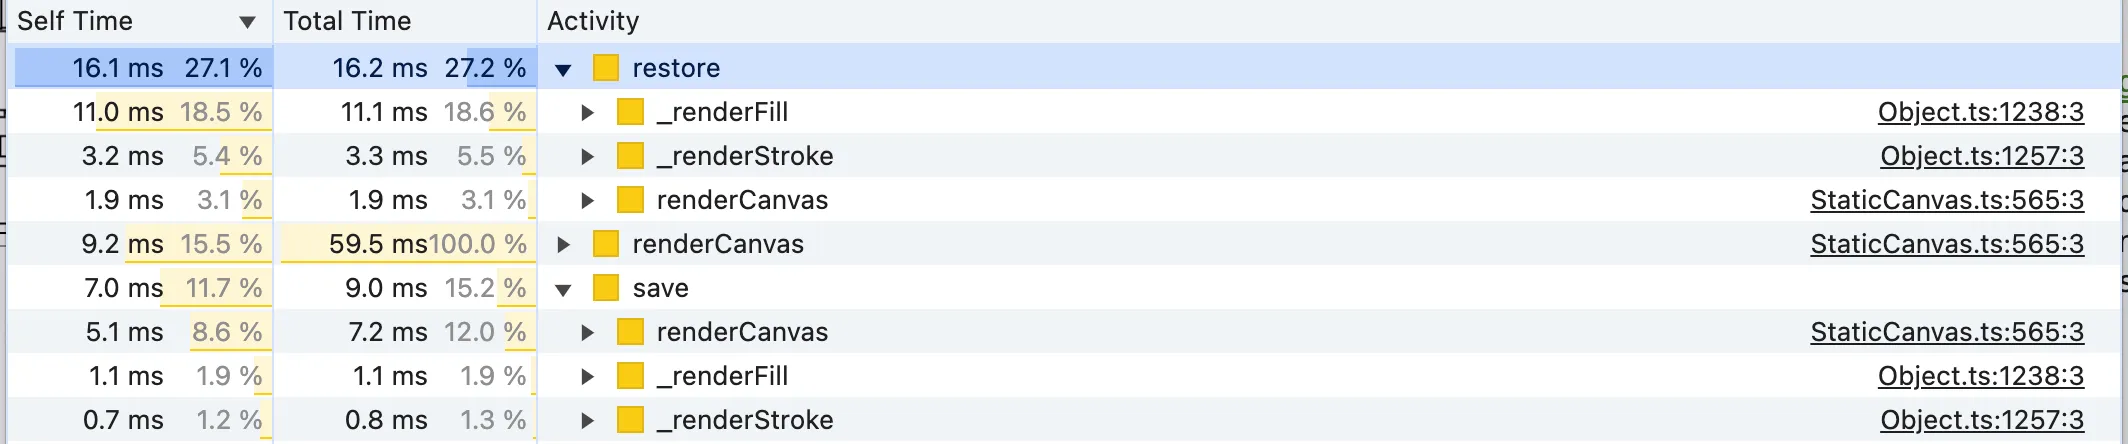
Since render is a subgraph of the renderCanvas flame graph and the former is what’s taking almost the whole execution time of the latter, we can expect the same expensive functions to be listed in both views. Indeed, let’s sort by descending Self Time first and we’ll notice that many top results are functions called by render:
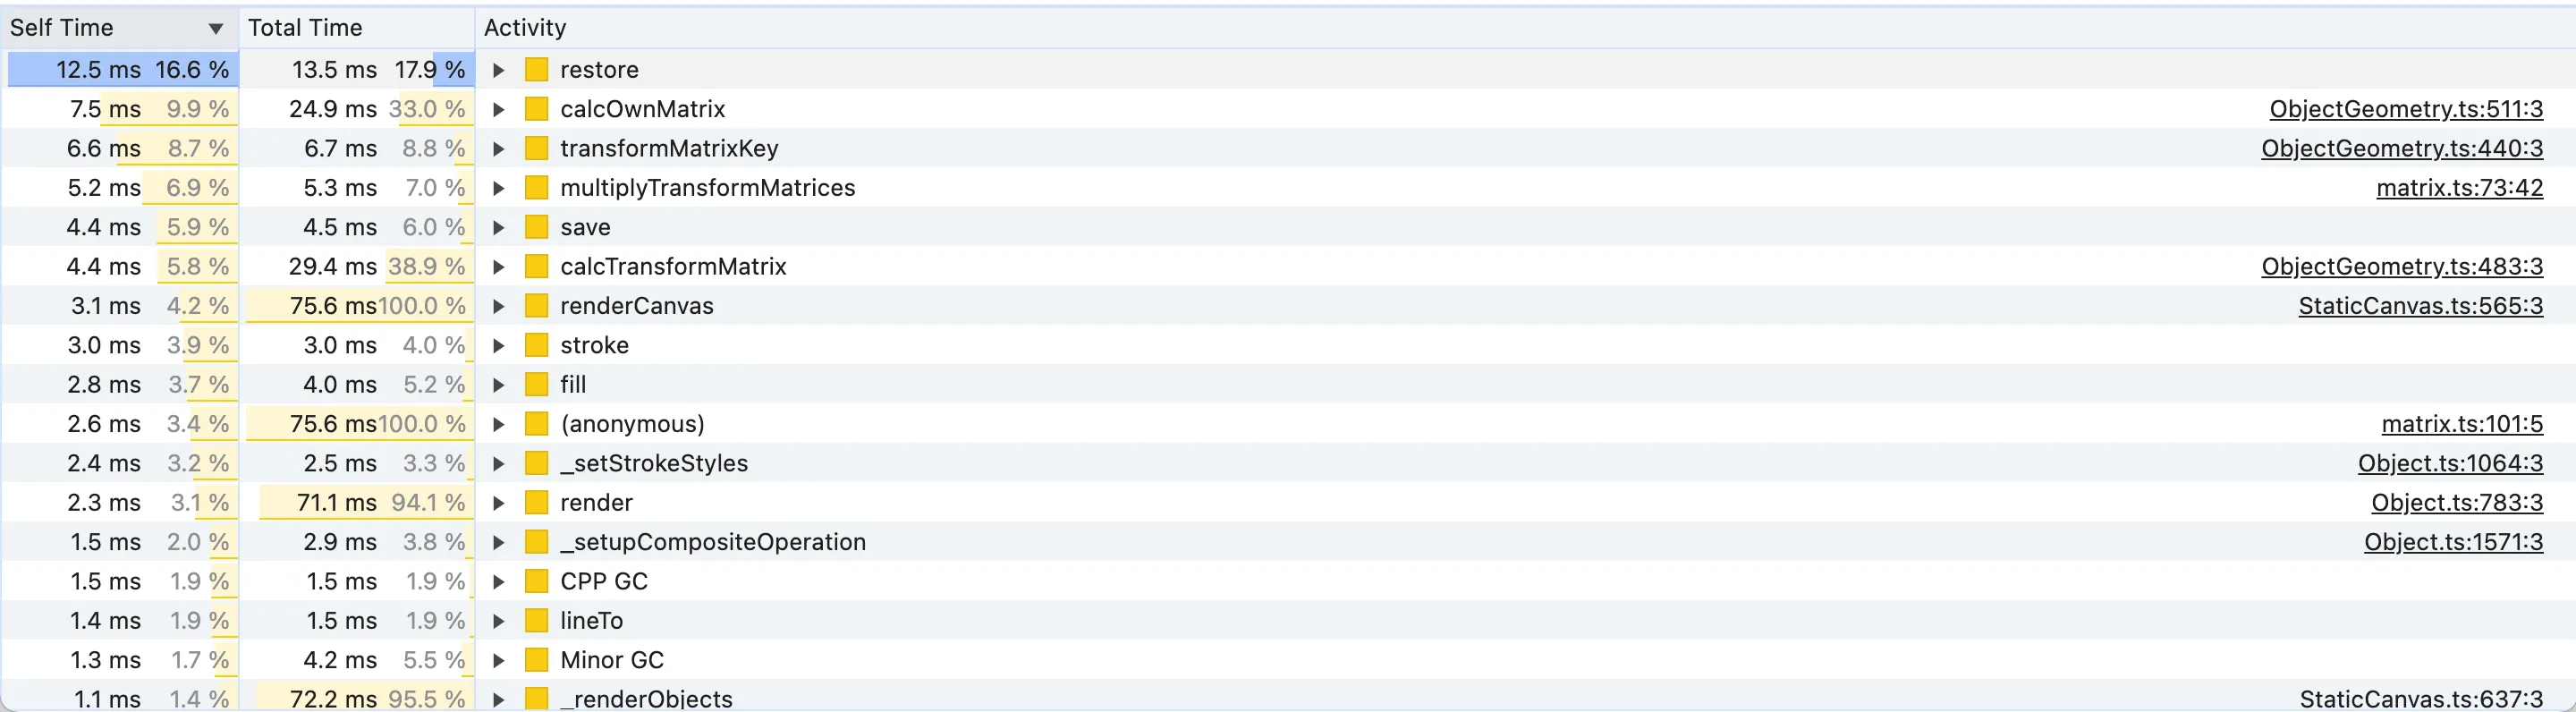
We have a few potential candidates, like restore, save, calcOwnMatrix, transformMatrixKey and multiplyTransformMatrices. It’s also worth noting that three of these methods involve “matrices”. That’s because canvas operations, such as rendering, fundamentally require computing the geometric transforms of points and objects, similar to CSS transforms that can translate, rotate or scale.
For the most curious of you, the mentioned matrix functions are the fabric.js equivalent of the standard JS DOMMatrix methods. If you want to read a brief explanation of why 2D rendering needs matrix transforms you can read the “Motivation” section of Dirty Flag optimisation pattern in game development. The existence of a well-known pattern to improve the computation of matrix transforms is proof that it’s expensive.
So if we improve the matrix calculations we get also a faster rendering.
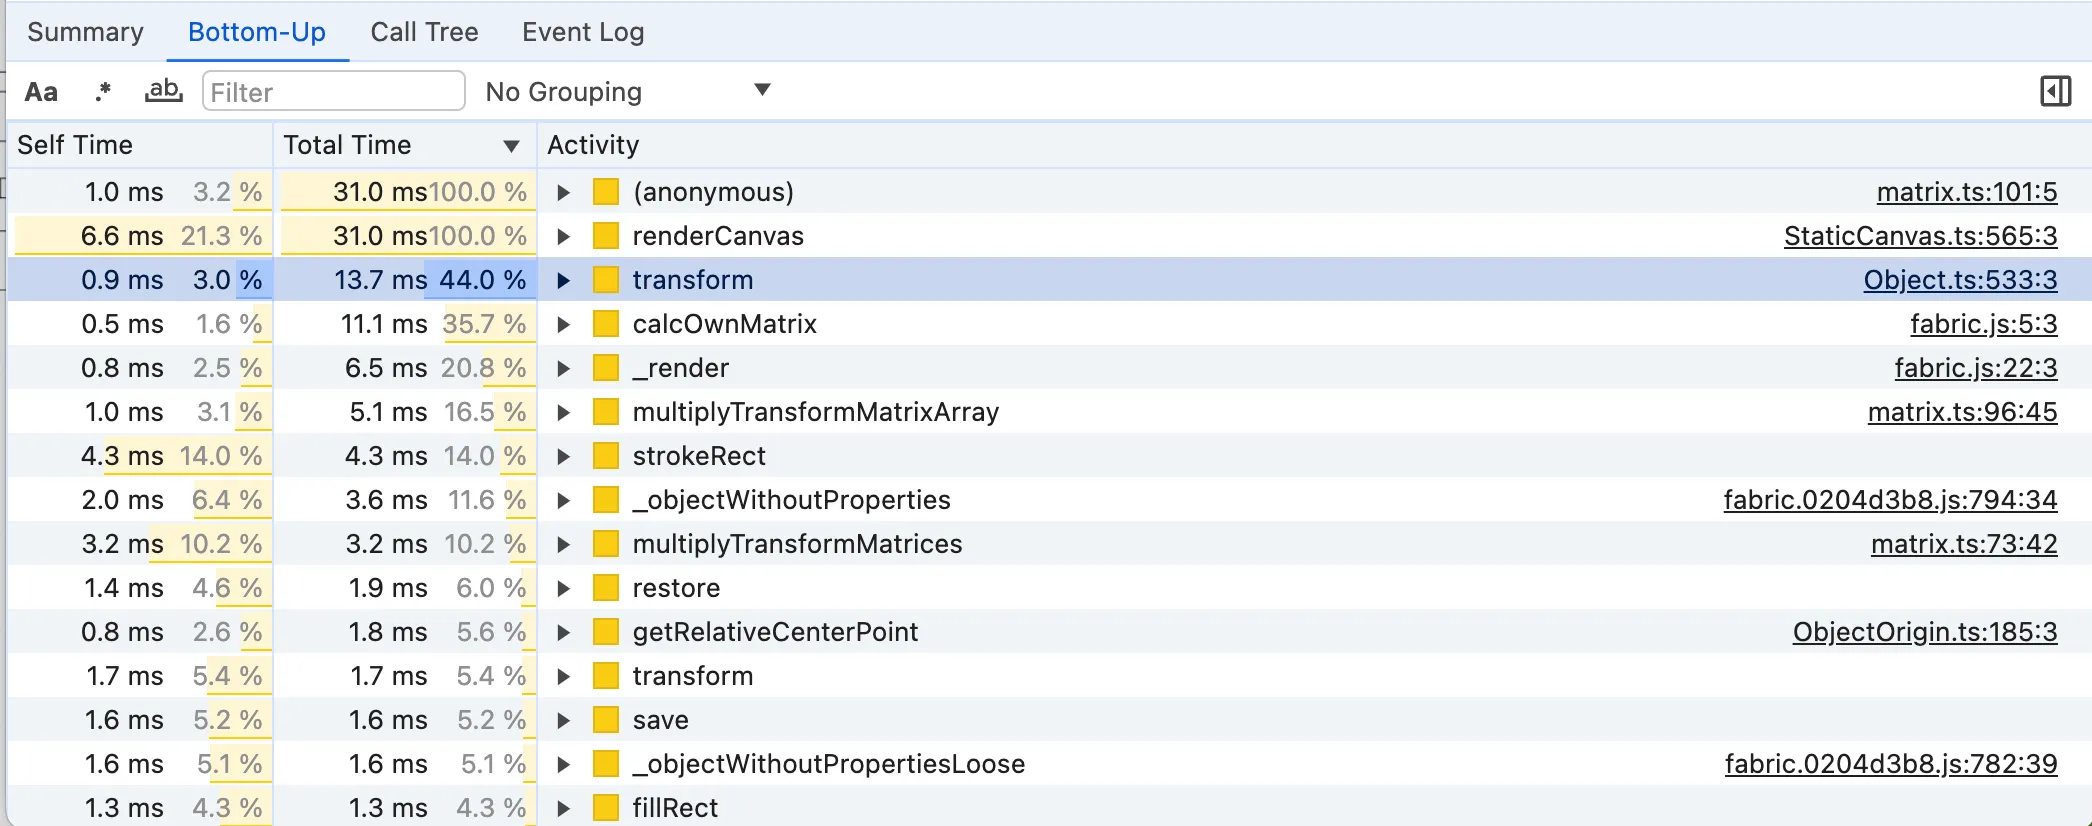
However before jumping into investigating matrix transforms, which sounds frightening, let’s sort the Bottom-Up list by Total Time as well:
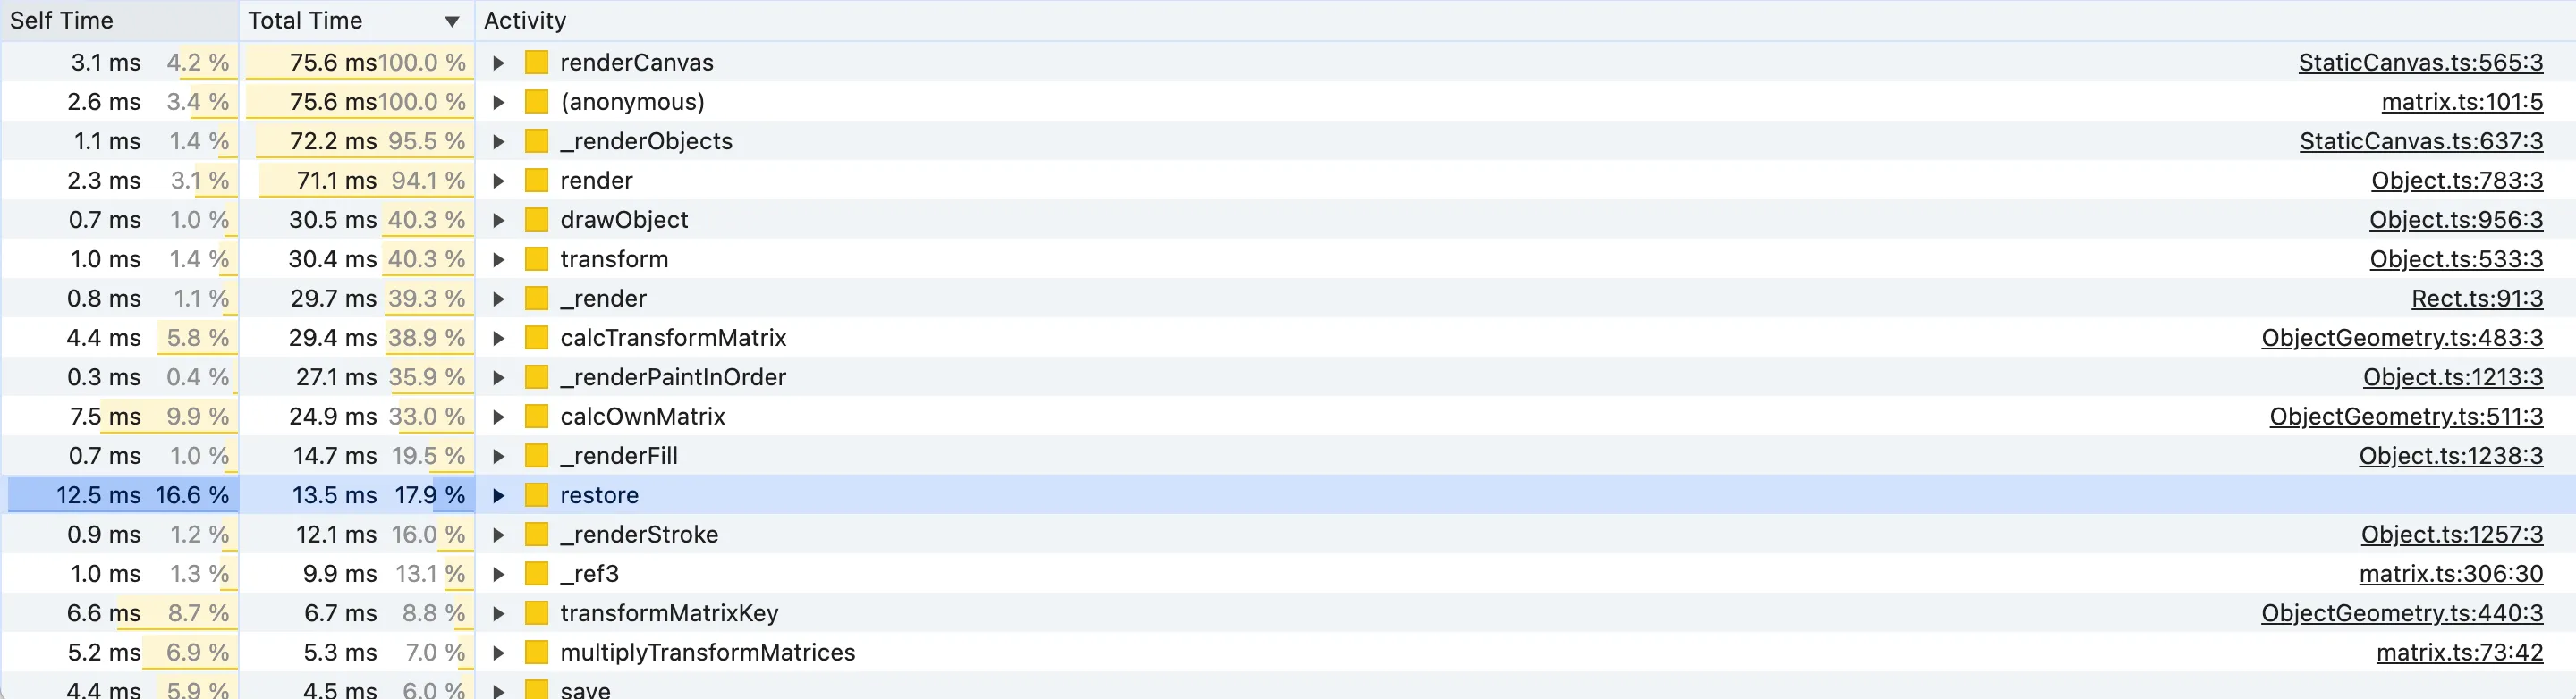
When looking at the Bottom-Up panel, we want to look for functions that have a high percentage of Total Time but at the same time, they are not up in the flame graph. It means that they take a good chunk of time despite not being a high-level function, i.e. they are expensive lower-level functions.
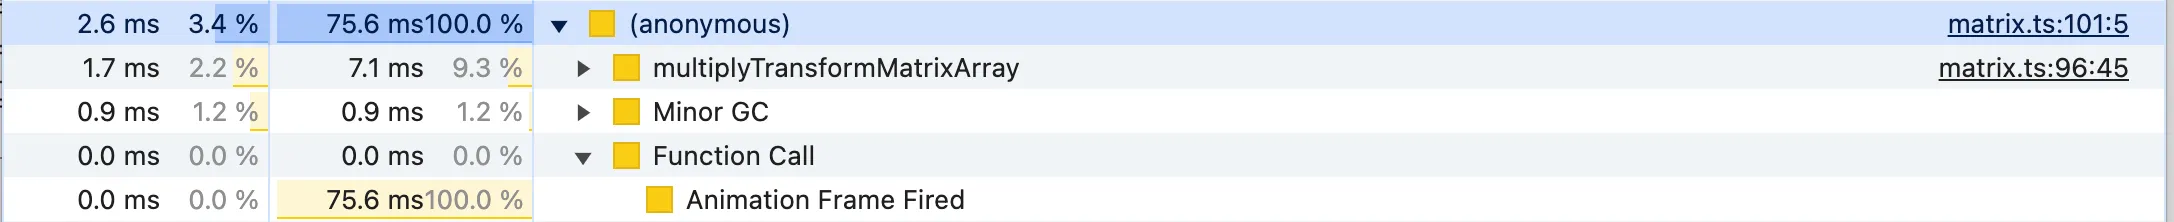
For instance, the renderCanvas method has a 100% Total Time but that’s obvious because it’s the function we have selected in the flame graph! The second result with the (anonymous) function is misleading as well. It has 100% Total Time because it includes all the anonymous functions, including the requestAnimationFrame callback for some reason, despite the source reference on the right might tell otherwise.
Knowing the meaning of the analysed code is important here to tell which functions have a significant Total Time despite being low-level. The interesting candidates here are: transform, _render, calcOwnMatrix, _renderPaintInOrder, restore, transformMatrixKey and multiplyTransformMatrices. A few notes about some of the functions:
drawObjectis excluded because it’s called byrenderand just delegates object rendering to_render, which is also in the list and has similar Total Time, meaning that it’s actually_renderthe probable cause of the runtimedrawObject(ctx: CanvasRenderingContext2D, forClipping?: boolean) { this._renderBackground(ctx); // ... this._render(ctx); }calcTransformMatrixis excluded similarly because it callscalcOwnMatrix, which has a similar Total Time in the list, so there is nothing oncalcTransformMatrixitself that’s interesting:calcTransformMatrix(skipGroup = false): TMat2D { let matrix = this.calcOwnMatrix(); // ... return matrix; }
Both analysis of functions by Self Time and Total Time seem to conclude that we should have a look at the matrix-related functions and save/restore().
Improve canvas rendering performance
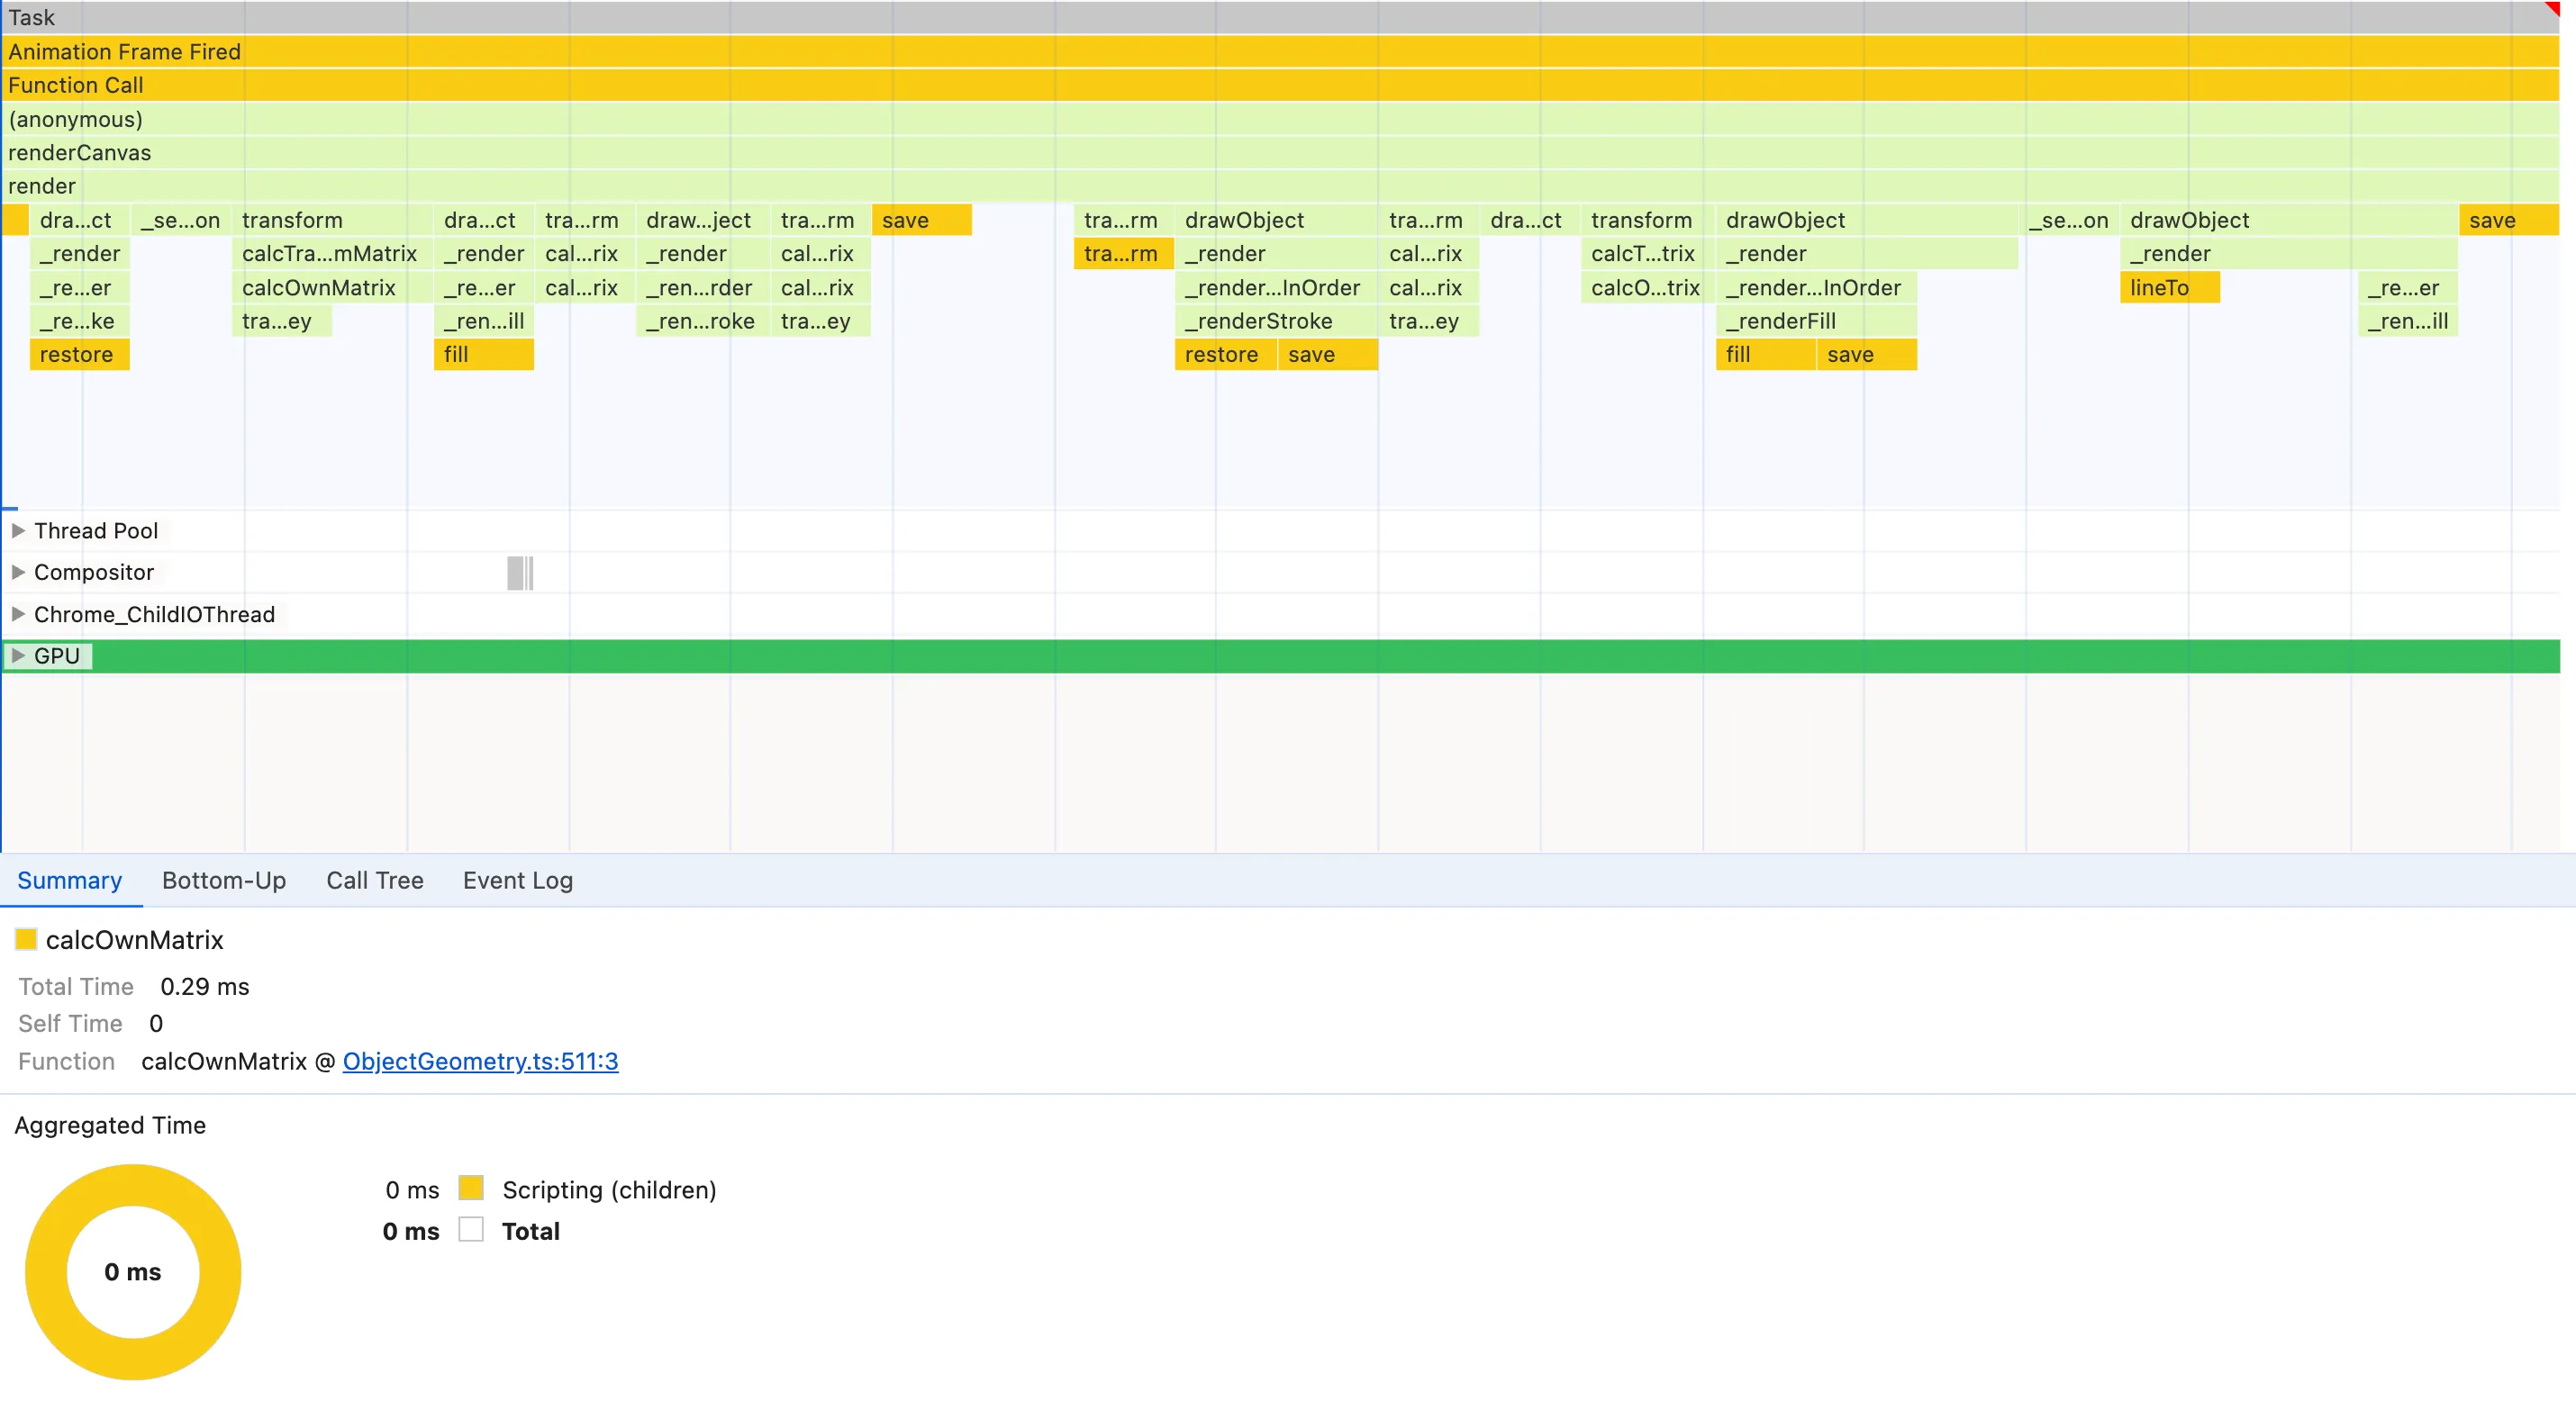
Now that we have our candidates, let’s try to dig into them. We’ll start with matrix-related functions. We have seen that calcOwnMatrix is taking considerable Self Time and Total Time.
calcOwnMatrix
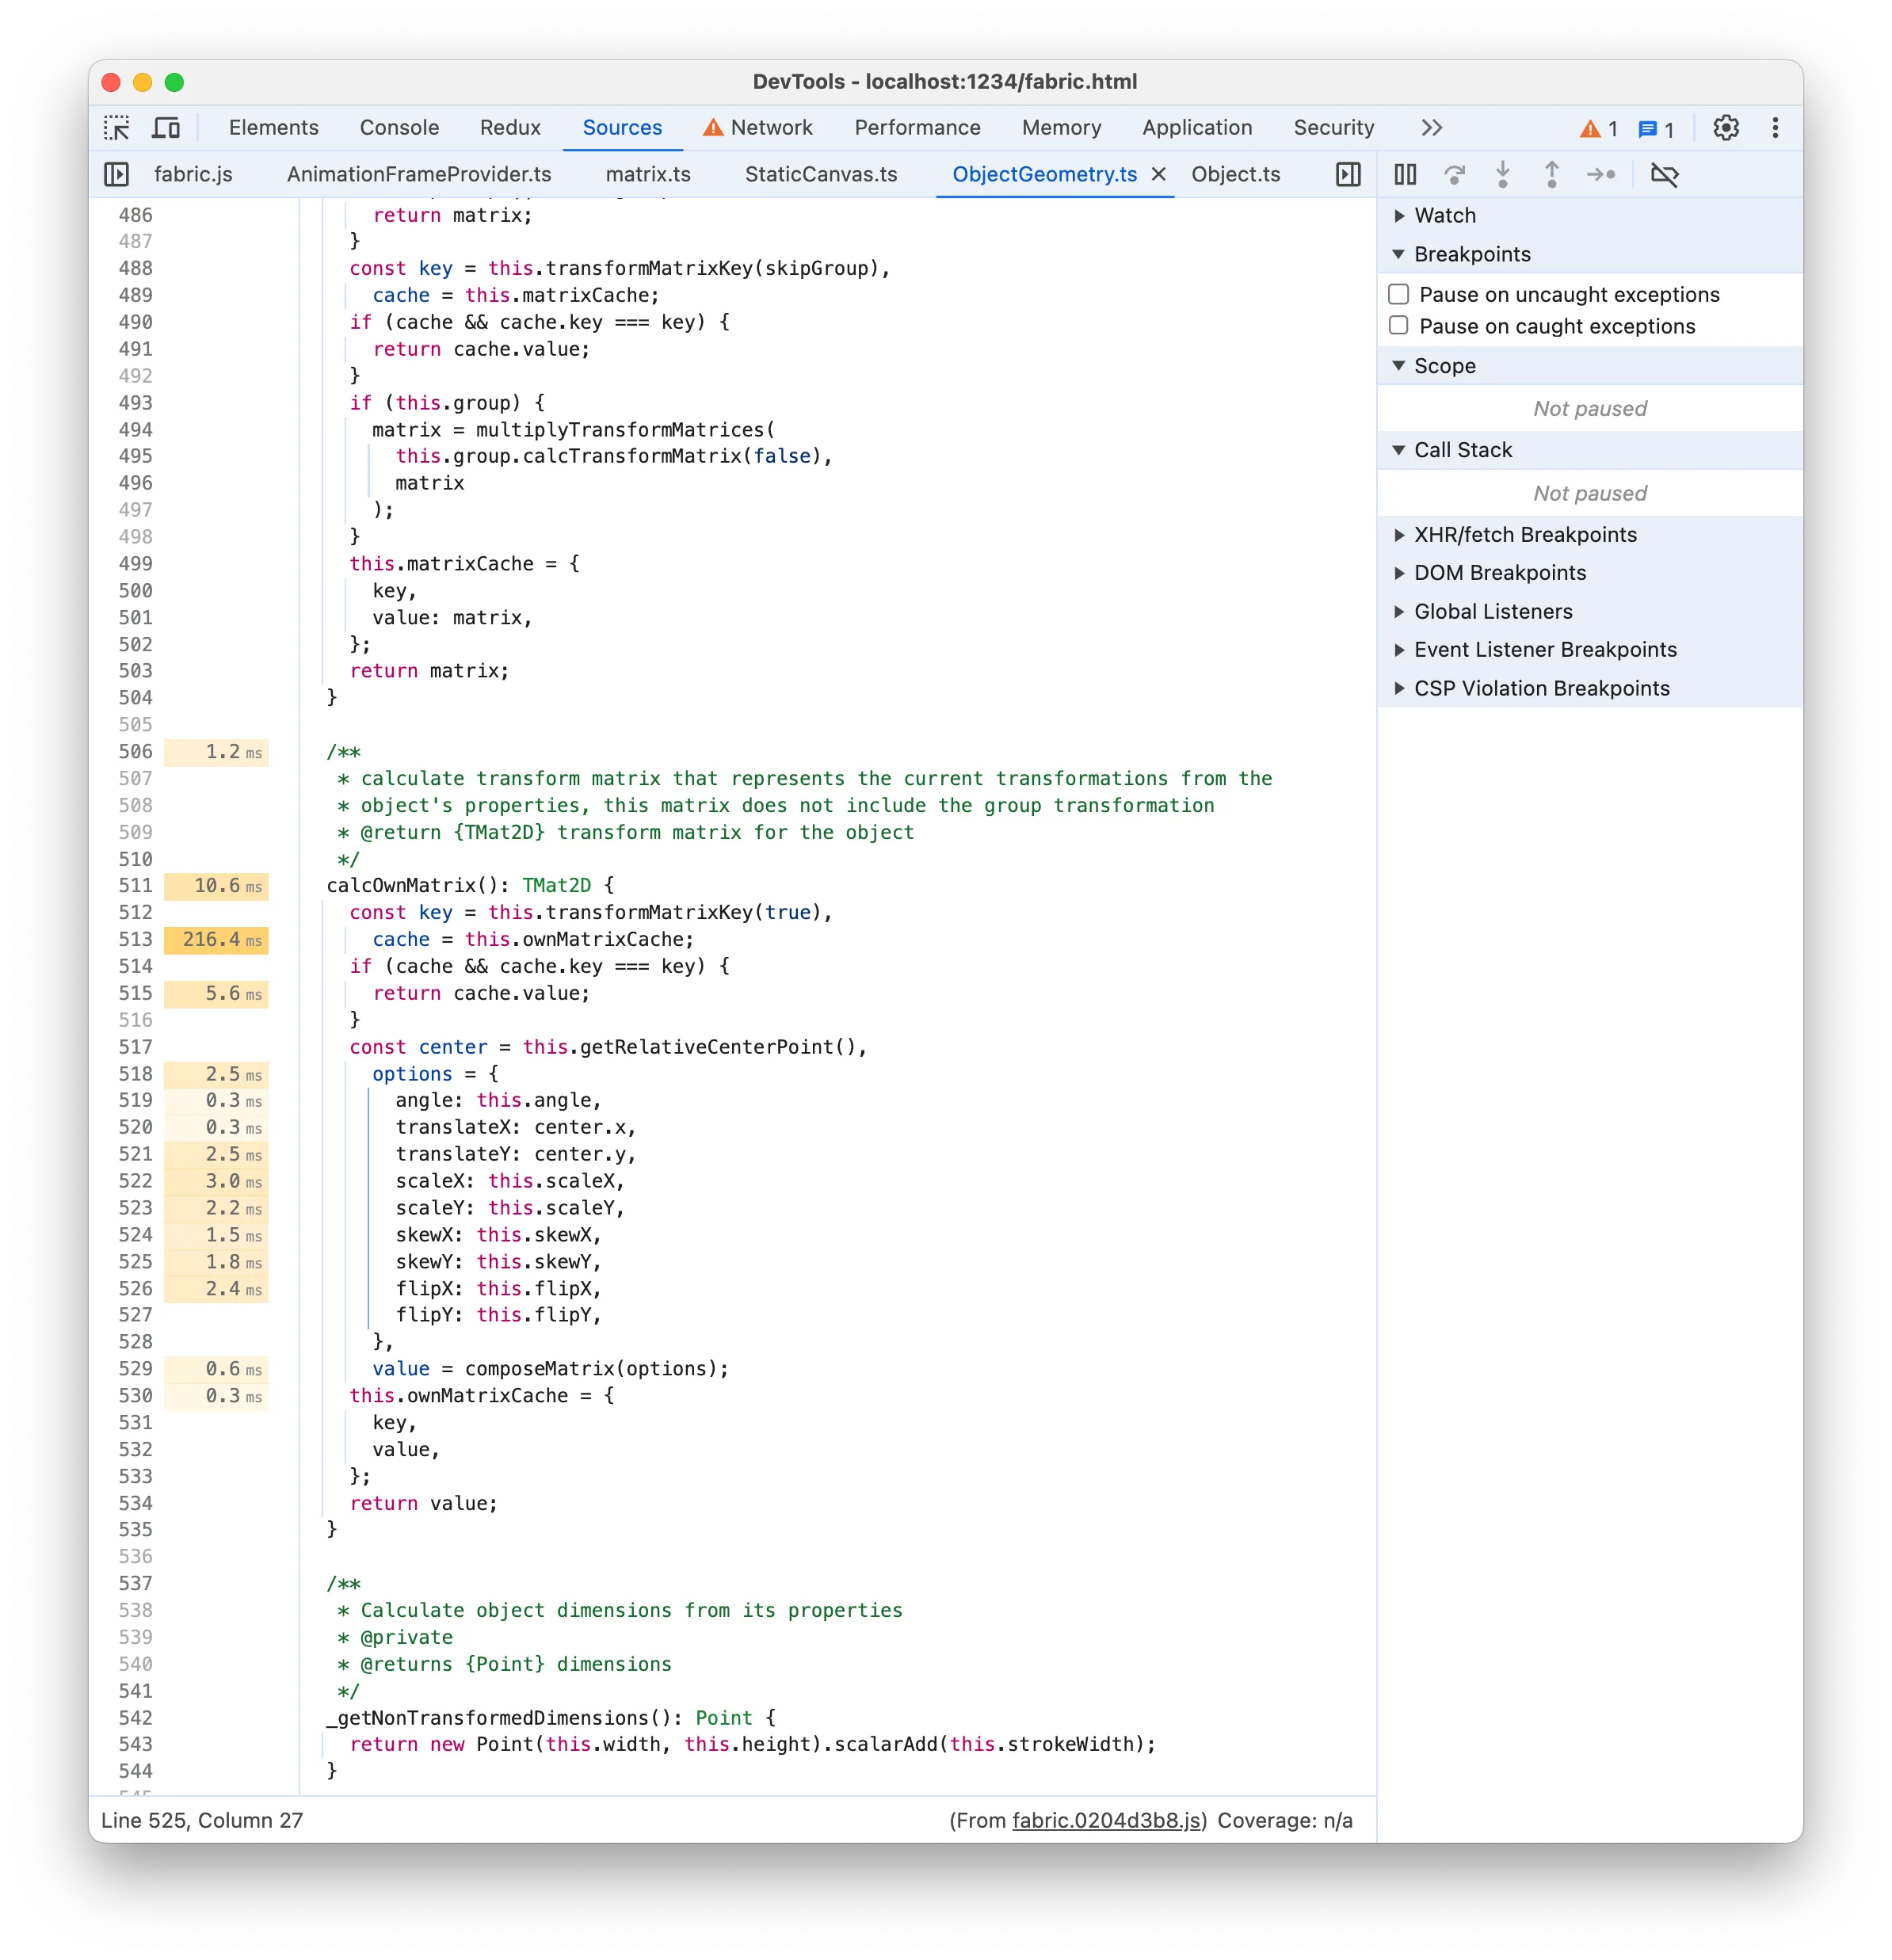
The 216ms time label seems to suggest that there is an expensive line of code, as it’s significantly larger than the other labels. It points to this.ownMatrixCache but that doesn’t make sense since it’s just reading a property. It’s more plausible that the real line is transformMatrixKey(), which if you remember was also listed in the expensive Bottom-Up functions! The function is responsible for getting a cache key to check if the transform matrix needs to be recomputed. A look at the transformMatrixKey Source implementation seems to confirm this:
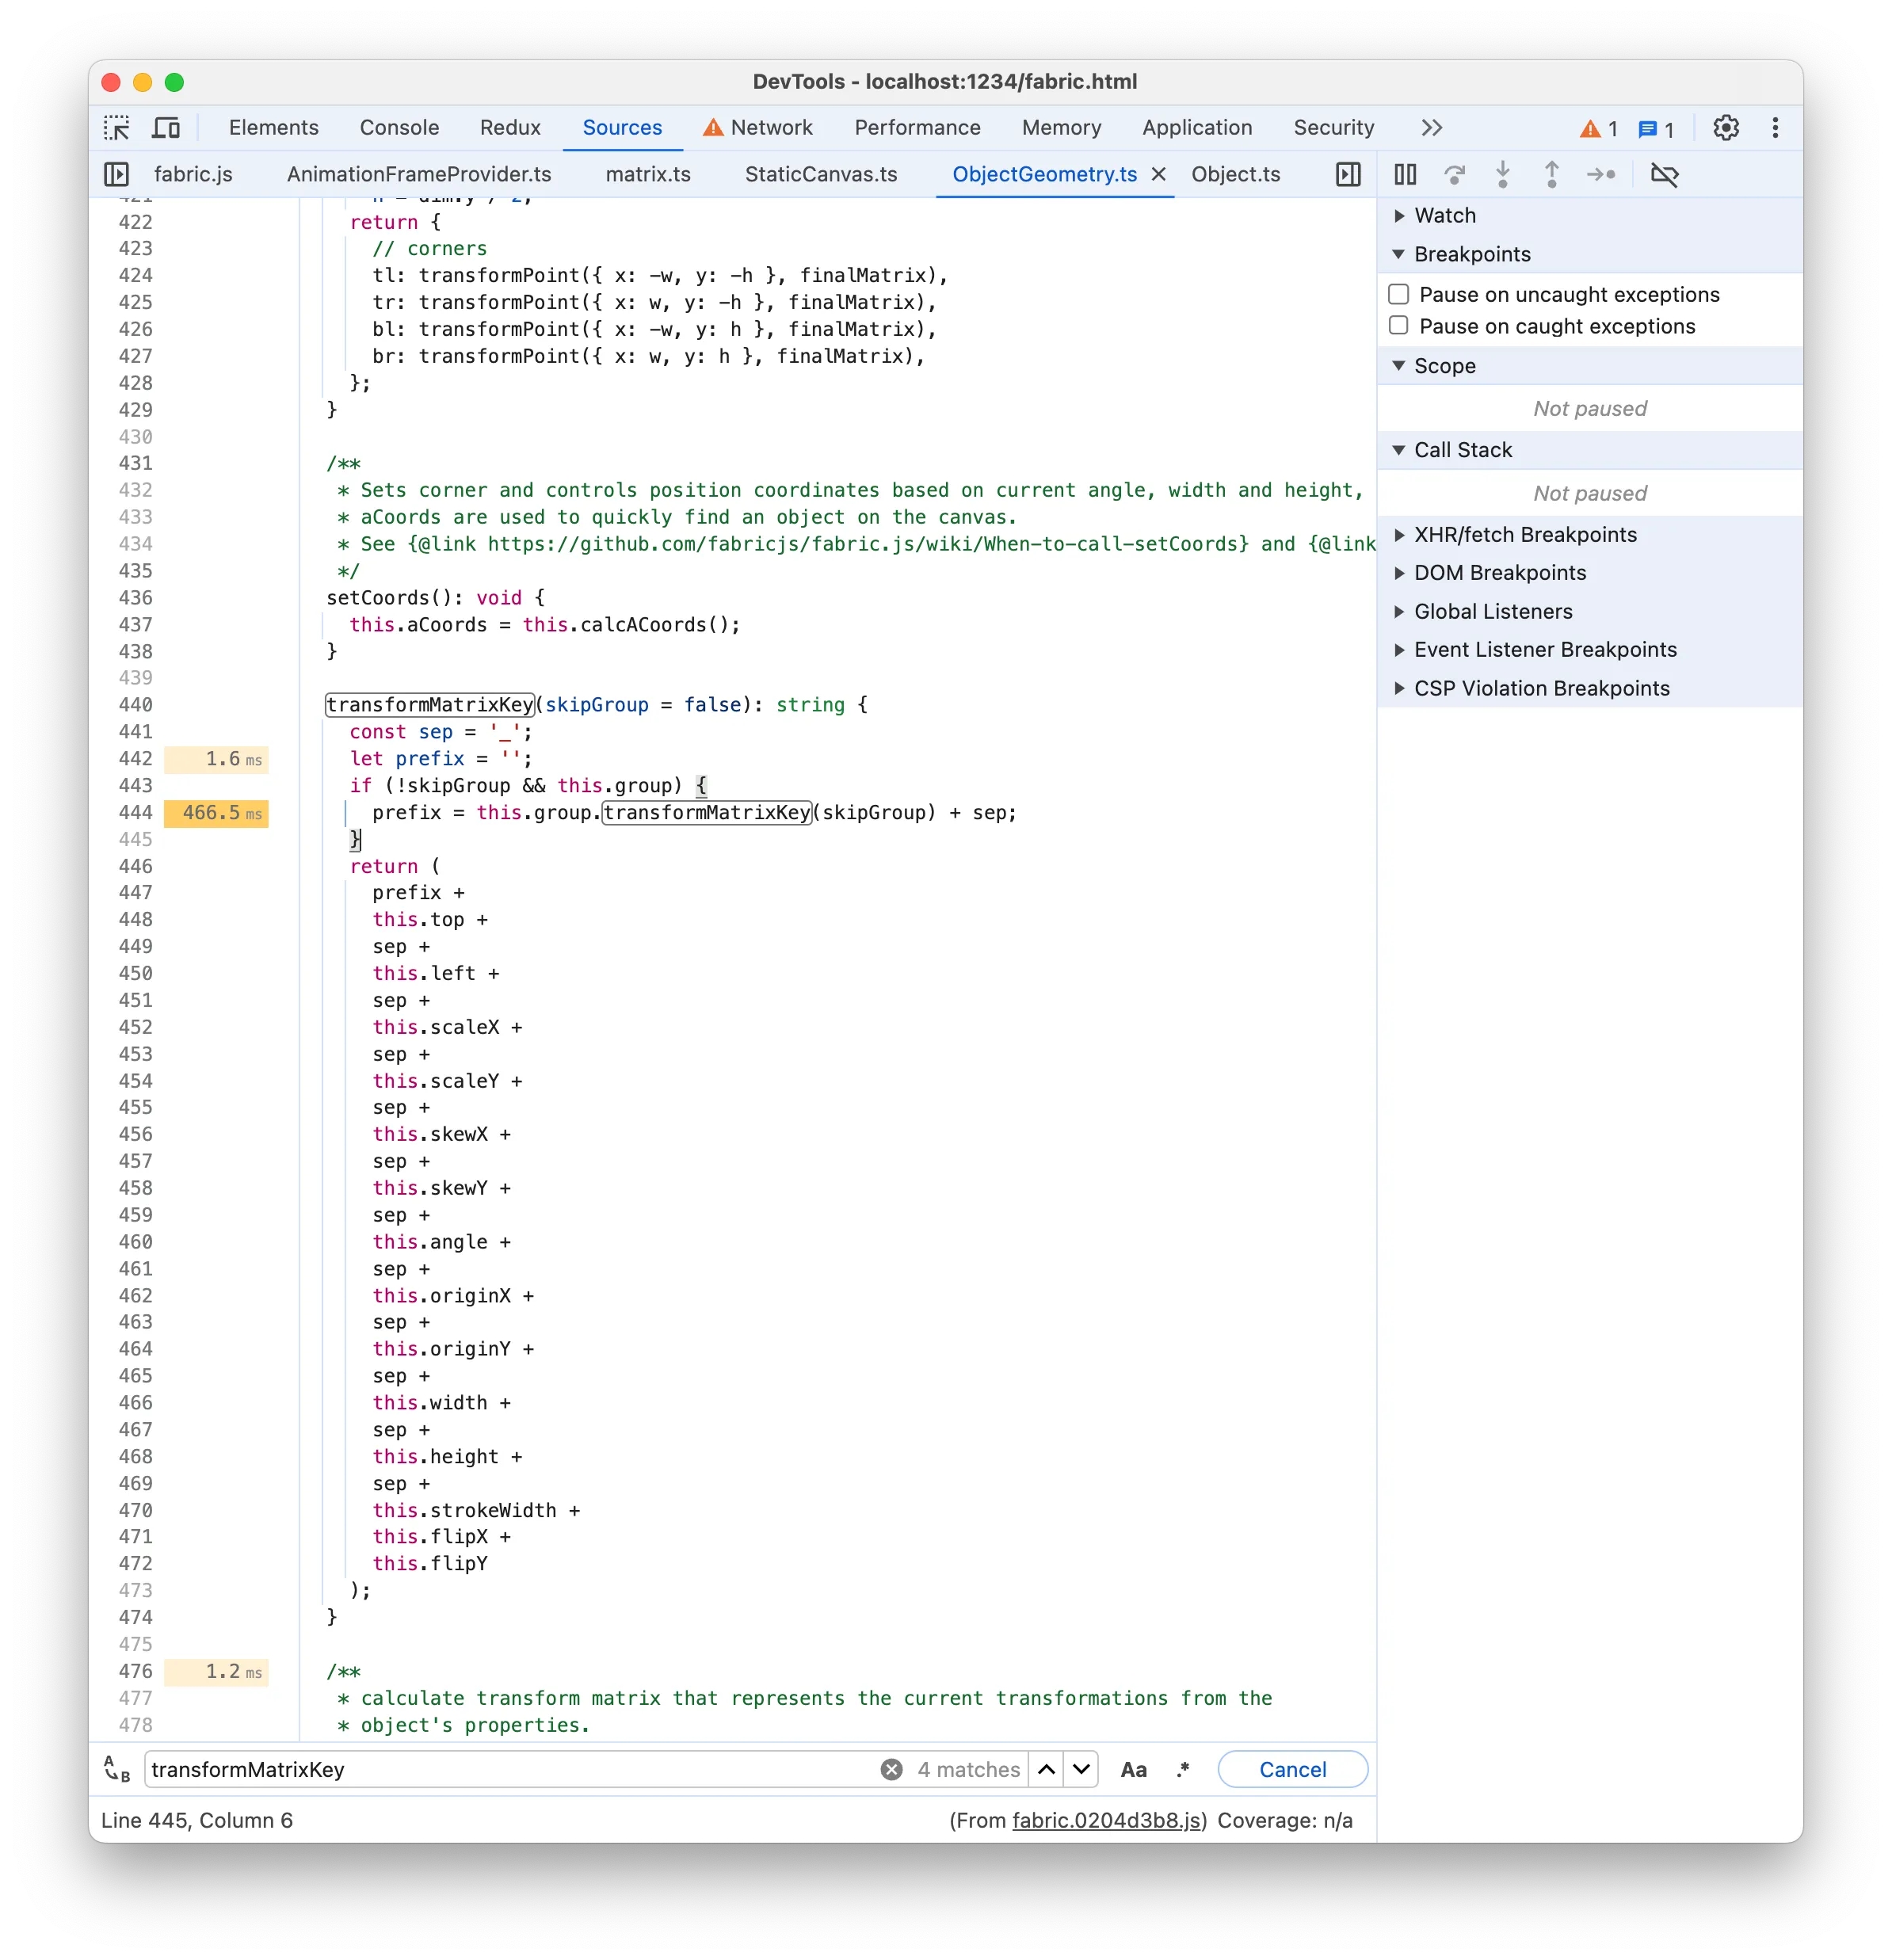
Again, the line of code is misleading. By looking at the code, we might think there’s some issue with expensive recursive calls of transformMatrixKey but we don’t have the this.group property on our benchmark rects because there are no groups. The faulty line is the return instruction, which creates a long string as cache. Working with a high-level language like JavaScript and not having to handle 100k network requests on the server typically means that we don’t have to worry about low-level stuff like String performance, but that doesn’t save us from paying the cost of expensive operations if we’re not careful. Creating and comparing large strings can get quickly expensive as shown in this large string comparison benchmark.
Taking into consideration that we’re animating and thus the rects are constantly changing position, using a cache is just unnecessary overhead so we can try removing matrix caching completely. In most cases, you’d probably try to think of a more efficient caching key instead, but that’s out of the scope of this article.
So let’s create our own OptimisedRect and override calcOwnMatrix to avoid using caching at all. If we reload the page and record Performance again, we’ll notice a significant improvement. On my M2 Pro:
- the page FPS meter now reaches 16fps (it was 13fps before)
- each Task in the Flame chart is around 65ms now (it was 77ms before)
- the
calcOwnMatrixSource is not displaying a time label with 216ms anymore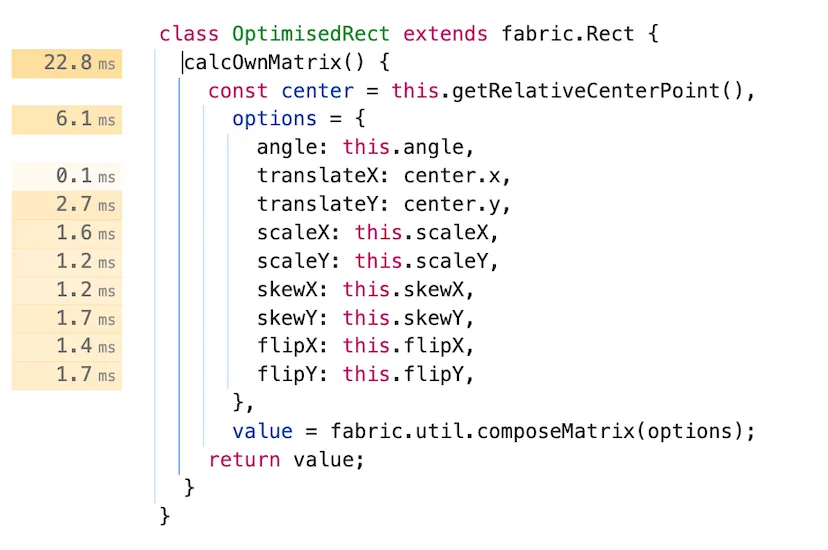
calcOwnMatrix no cache Source
That’s overall a 20% improvement.
CanvasRenderingContext2D save/restore
Out next candidate based on the Bottom-Up analysis is ctx.save/restore(). This is a highly canvas-specific optimisation, but it seems that using saving and restoring the canvas drawing state has a non-negligible cost. The cost seems to depend both on the GPU and 2D Context State. Using the Bottom-Up panel we can see who calls save/restore:
Let’s check the Source of _renderFill and _renderStroke:
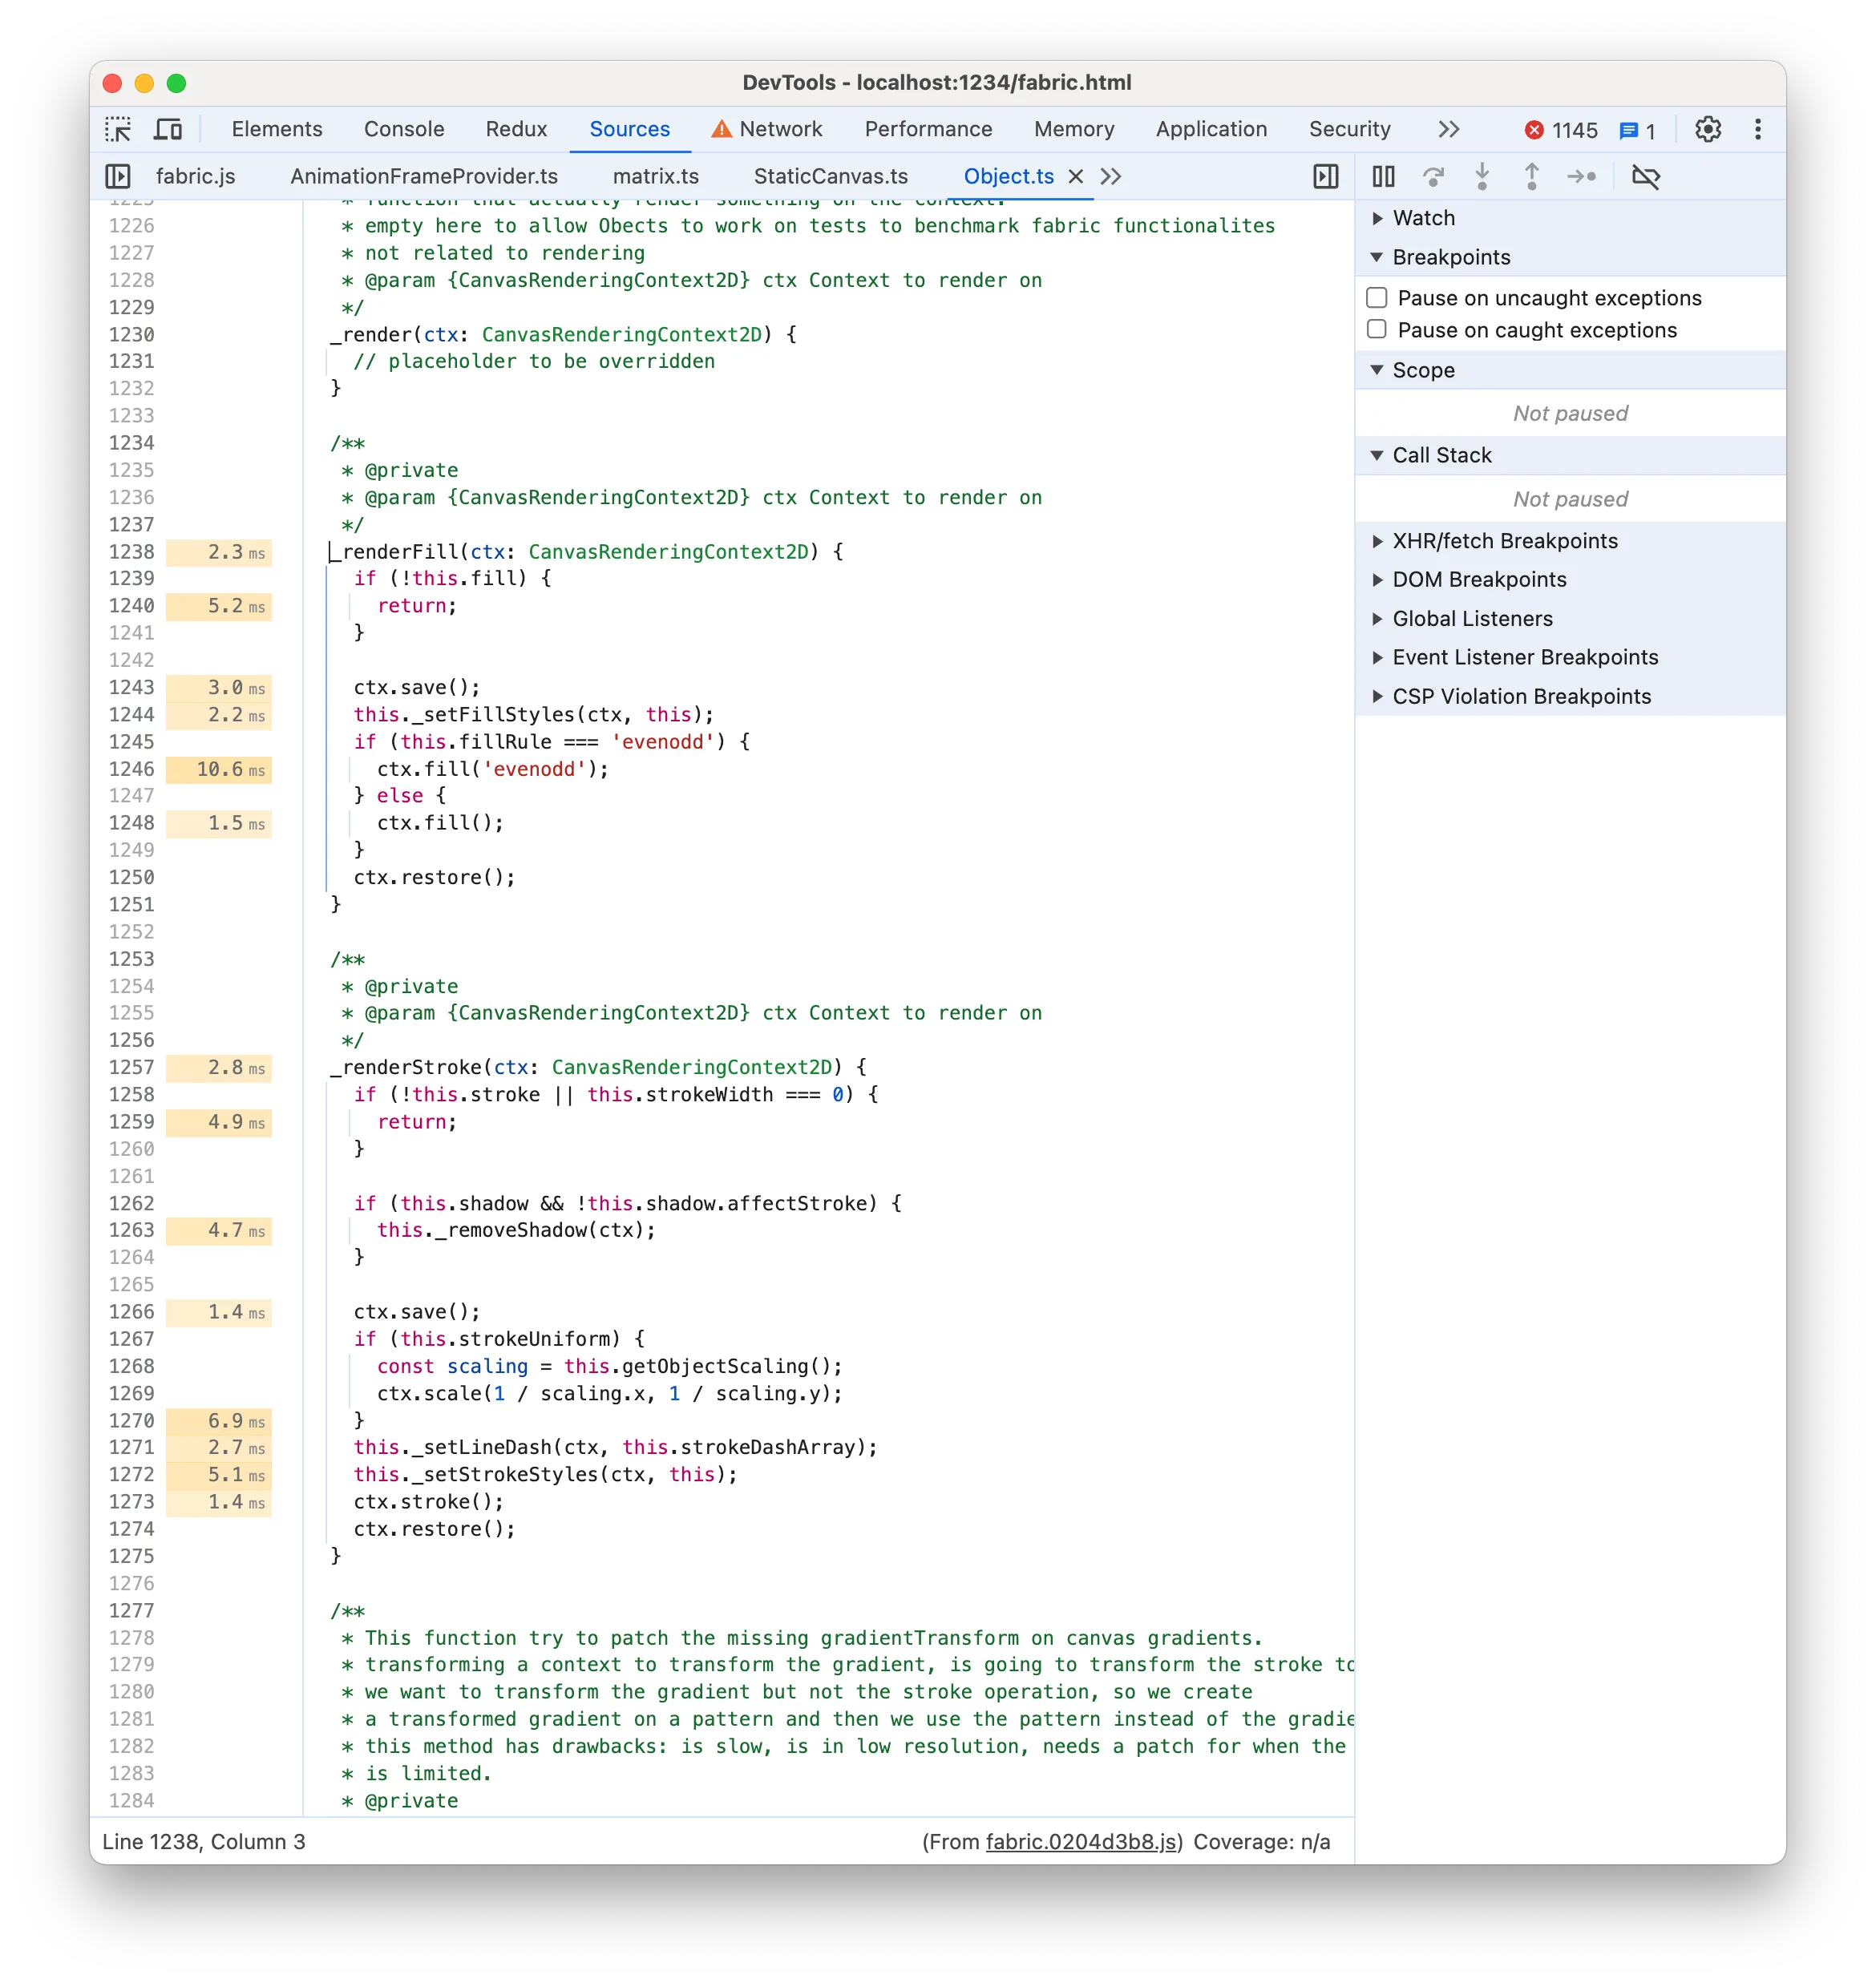
There is nothing particularly noticeable but it’s true that ctx.save/restore is unnecessary for filling and stroking the rects. We’re not using any feature like strokeUniform (to render uniform rect borders despite the parent group scale) and fabric.js already calls ctx.save/restore() (i.e. pushes a new drawing state) for each rect render call. So doing it before rendering the stroke or fill as well is wasteful.
Once again we save and record Performance:
- the page FPS meter now reaches 20fps (it was 16fps before)
- each Task in the Flame chart is around 50ms now (it was 65ms before)
That’s an additional ~25% improvement and we’re close to 24fps at least!
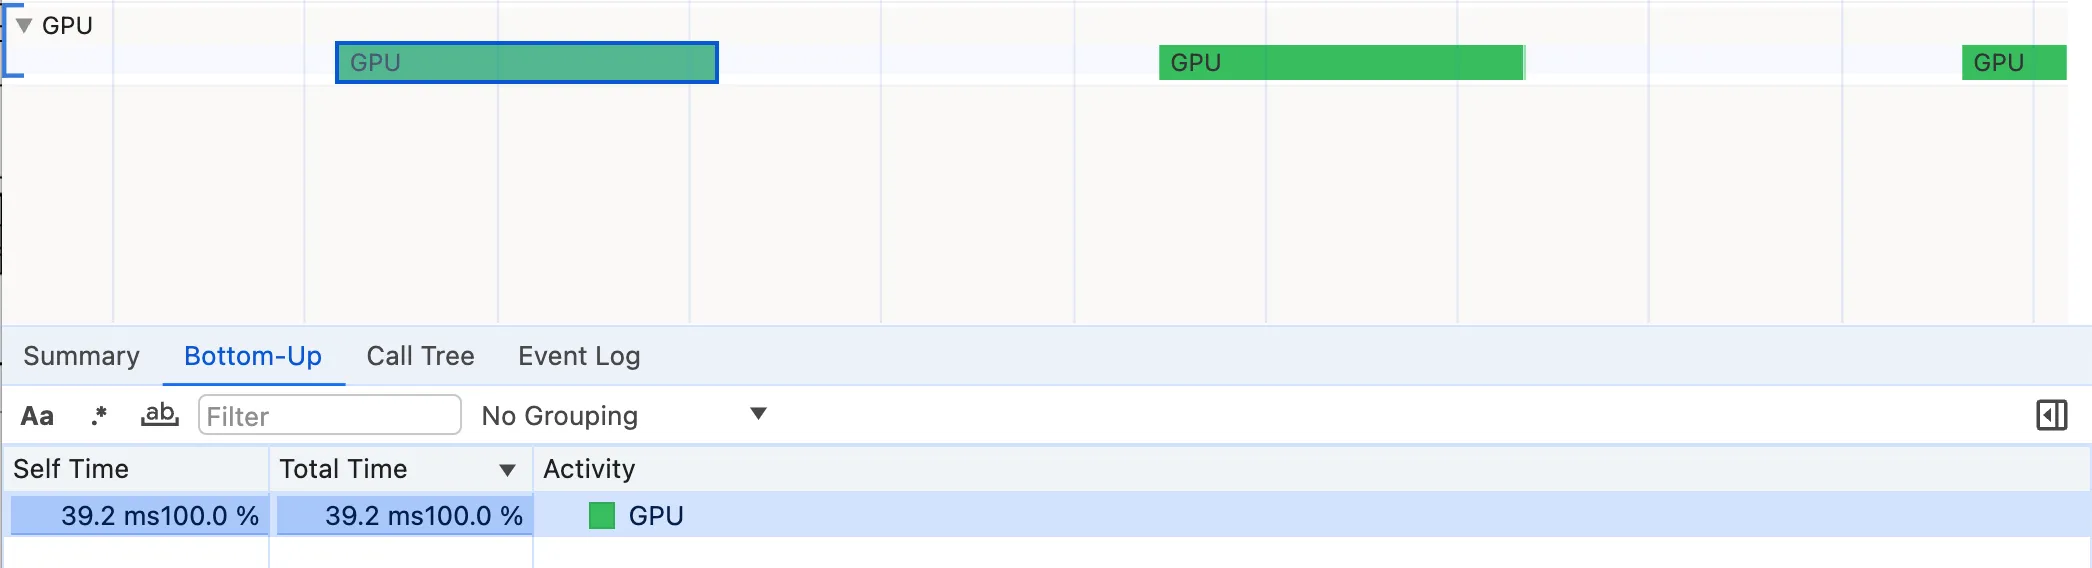
beginPath vs fillRect GPU time
Our next target according to the Bottom-Up list is _render, which renders the rect using canvas 2D operations:
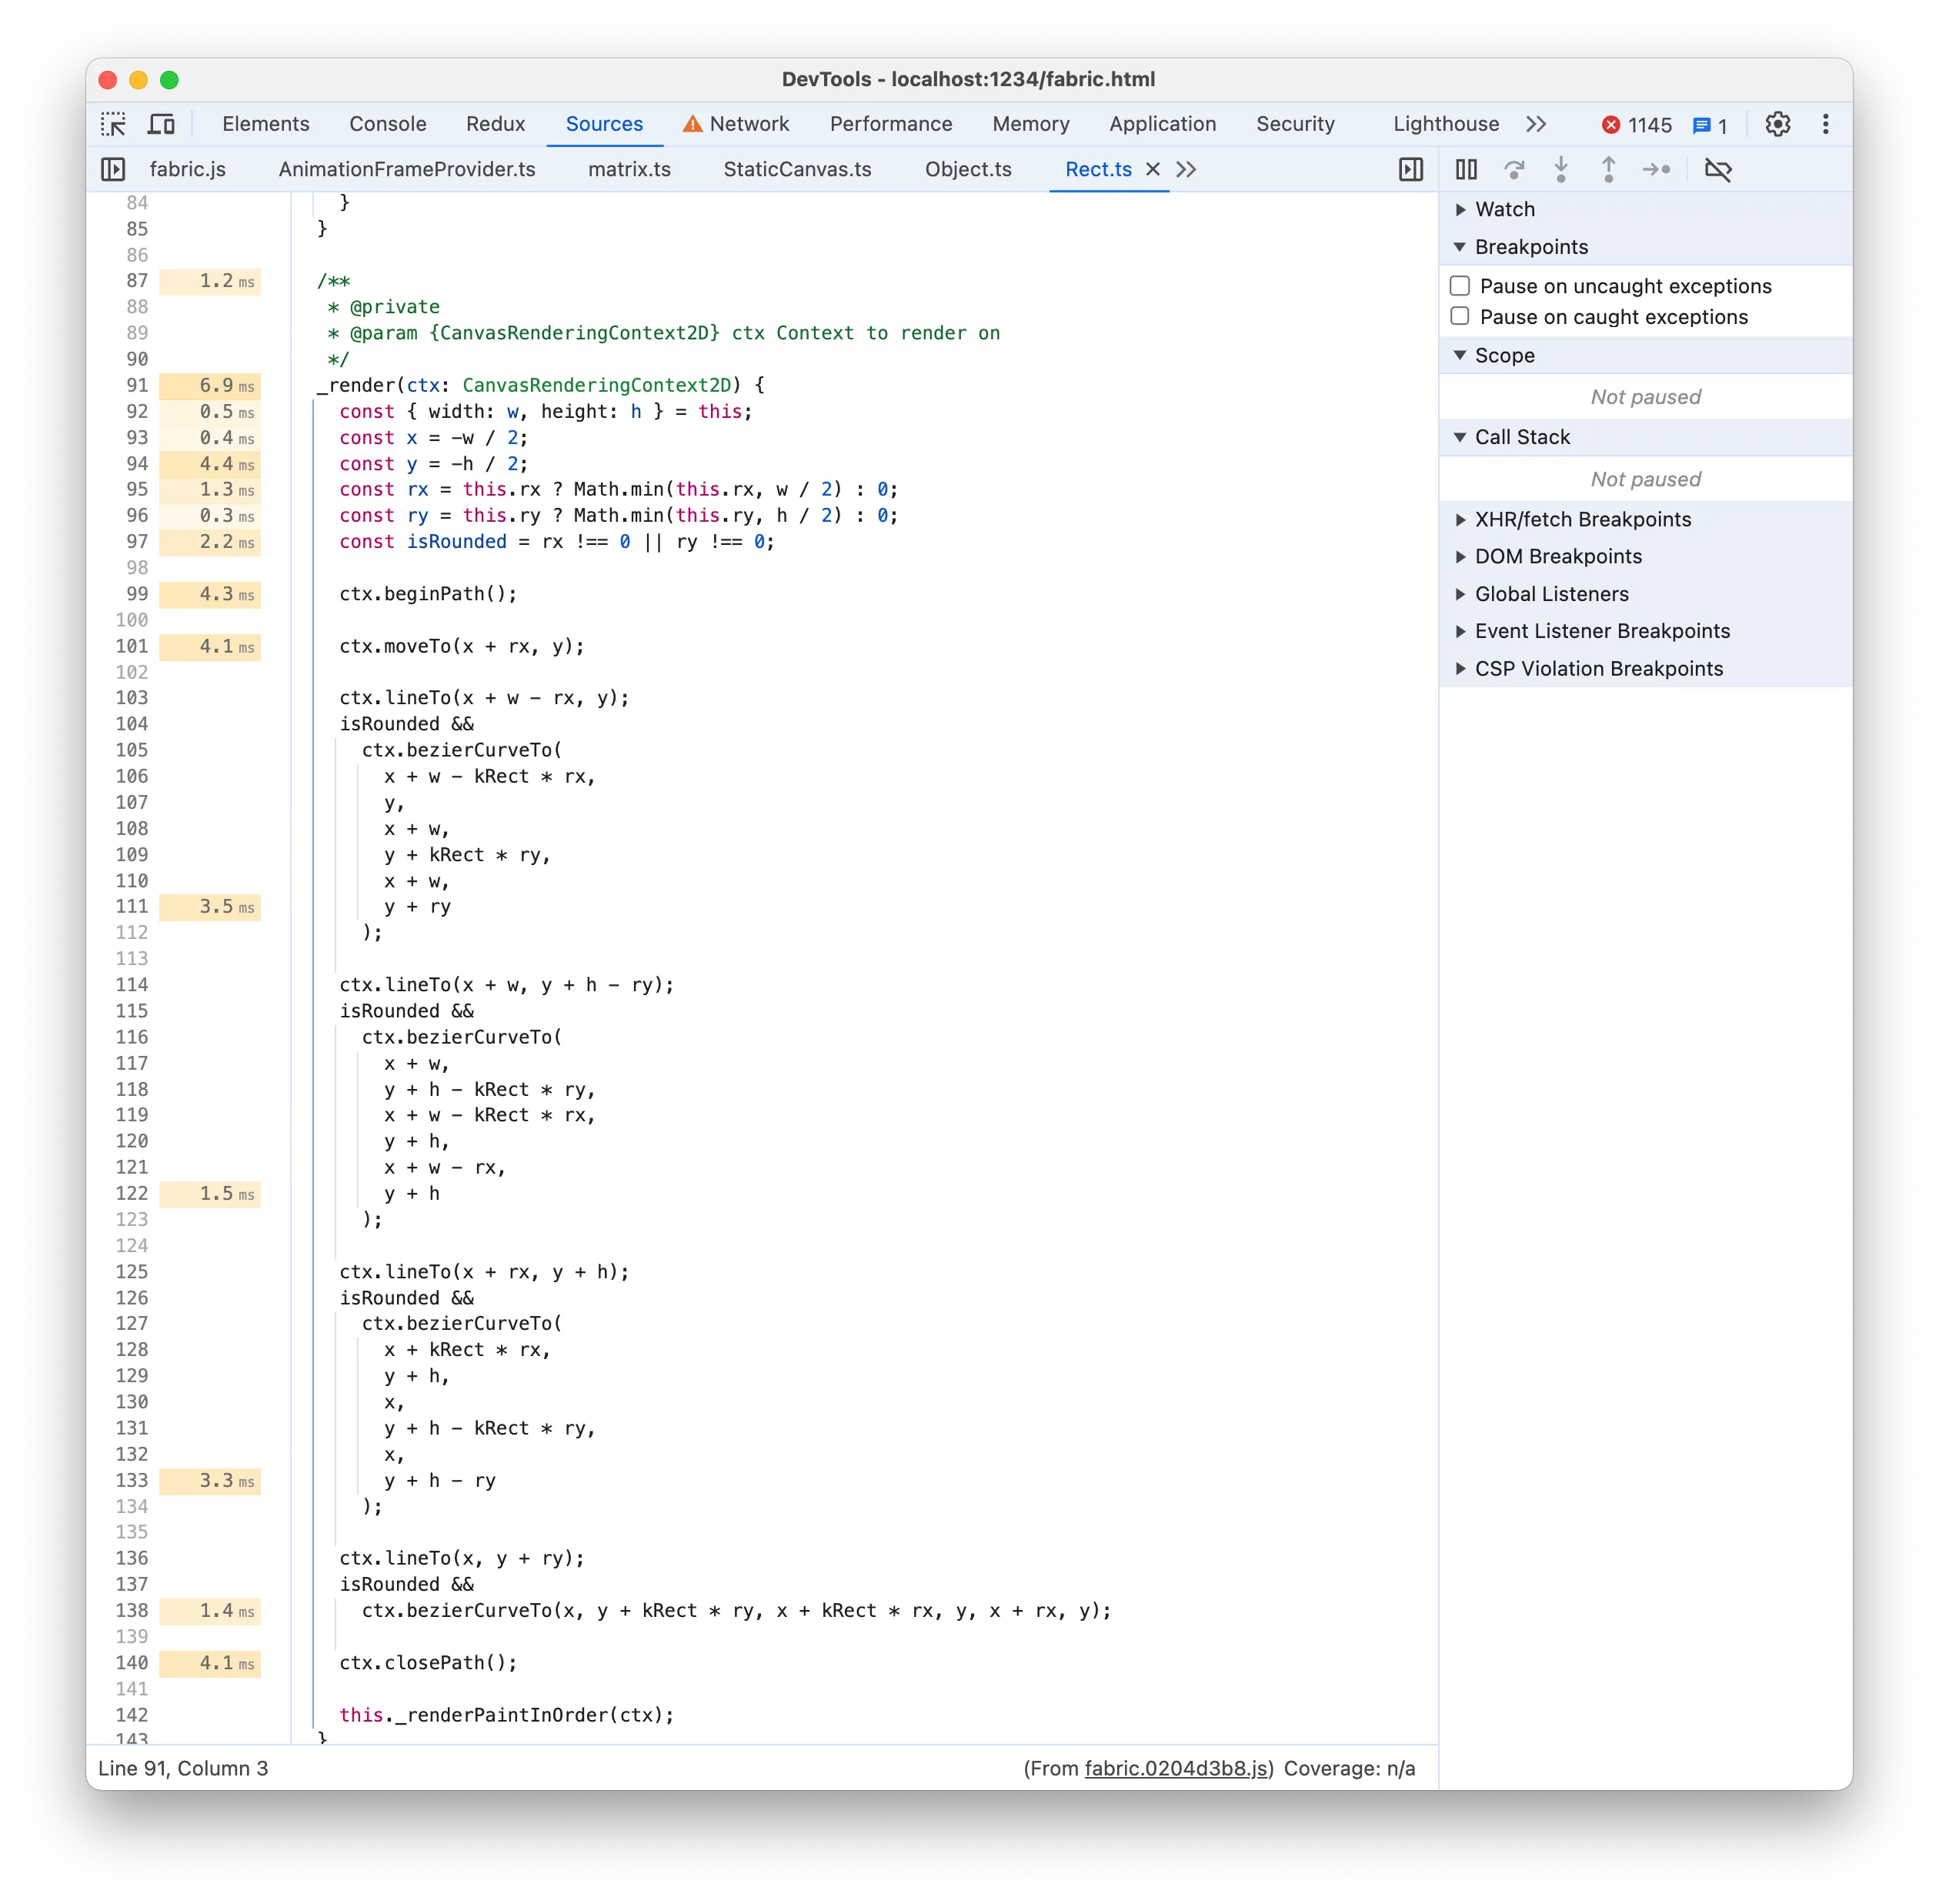
Rendering a simple rectangle using a combination of 2D Path commands seems unnecessary when you can just do strokeRect and fillRect and get the same result. Let’s try it:
_render(ctx) {
  ctx.strokeRect(-this.width / 2, -this.height / 2, this.width, this.height);
  ctx.fillStyle = 'white';
  ctx.fillRect(-this.width / 2, -this.height / 2, this.width, this.height);
}
Note that we have replaced both 2D Path commands and the _renderFill and _renderStroke functions, by directing calling strokeRect and fillRect.
Once again we save and record Performance:
- the page FPS meter now reaches 28fps (it was 20fps before)
- each Task in the Flame chart is around 32ms now (it was 50ms before)
That’s an additional ~40% improvement and we’ve reached our goal of 24fps!
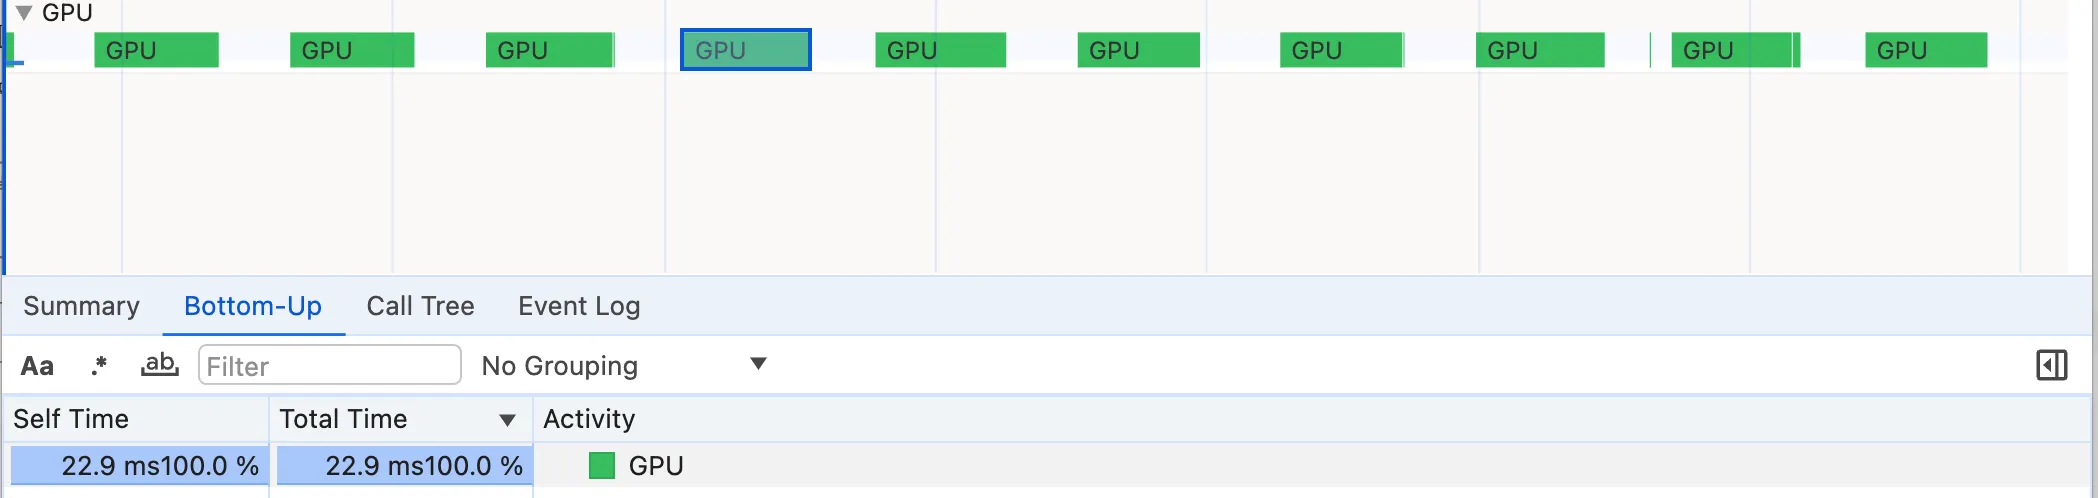
This may come as a surprise since the Source Time labels did not show significant numbers. However, if we compare the GPU times we notice a substantial decrease from 39ms to 23ms. It’s hard to tell exactly why the GPU executes fillRect instructions faster than beginPath instructions. On a wild guess, I’d say it’s because a series of direct fillRect and strokeRect instructions are simpler to parallelize and execute by the GPU. If you know better, please leave a comment.
Matrix transforms
Our updated Bottom-Up list sorted by Total Time now comprises mostly matrix functions, notably transform, calcOwnMatrix, multiplyTransformMatrixArray and multiplyTransformMatrices. So far we have avoided digging into these frightening Math functions but it seems it’s time to tackle them!
multiplyTransformMatrixArray and multiplyTransformMatrices are raw matrix calculation functions.
const multiplyTransformMatrixArray = (
  matrices: (TMat2D | undefined | null | false)[],
  is2x2?: boolean
) =>
  matrices.reduceRight(
    (product: TMat2D, curr) =>
      curr ? multiplyTransformMatrices(curr, product, is2x2) : product,
    iMatrix
  );

const multiplyTransformMatrices = (
  a: TMat2D,
  b: TMat2D,
  is2x2?: boolean
): TMat2D =>
  [
    a[0] * b[0] + a[2] * b[1],
    a[1] * b[0] + a[3] * b[1],
    a[0] * b[2] + a[2] * b[3],
    a[1] * b[2] + a[3] * b[3],
    is2x2 ? 0 : a[0] * b[4] + a[2] * b[5] + a[4],
    is2x2 ? 0 : a[1] * b[4] + a[3] * b[5] + a[5],
  ] as TMat2D;
It’s hard to improve them further unless someone knows how to unleash demonic bitwise operations. Even then, I doubt that a significant change is possible.
If we look at transform instead, we notice that it internally calls calcOwnMatrix:
transform(ctx: CanvasRenderingContext2D) {
  // ...
  const m = this.calcTransformMatrix(true);
  ctx.transform(m[0], m[1], m[2], m[3], m[4], m[5]);
}
Even though we have already optimised calcOwnMatrix to avoid using cache keys, it still accounts for a good chunk of the Total Time. However, we realise that our rects are always just translating in the animation, so there is no need to compute the full generic matrix in calcOwnMatrix, taking into account scale, rotation etc.
calcOwnMatrix() {
  const center = this.getRelativeCenterPoint();
  const matrix = fabric.util.createTranslateMatrix(center.x, center.y)
  return matrix;
}
Once again we save and record Performance:
- the page FPS meter now reaches 36fps (it was 28fps before)
- each Task in the Flame chart is around 22ms now (it was 50ms before)
That’s once again a ~30% improvement and now the benchmark runs smoothly! Your computer will likely not spin up the fans as well. We’ve made it!
Final look at the Performance recording
This was our Performance recording at the beginning of the journey:
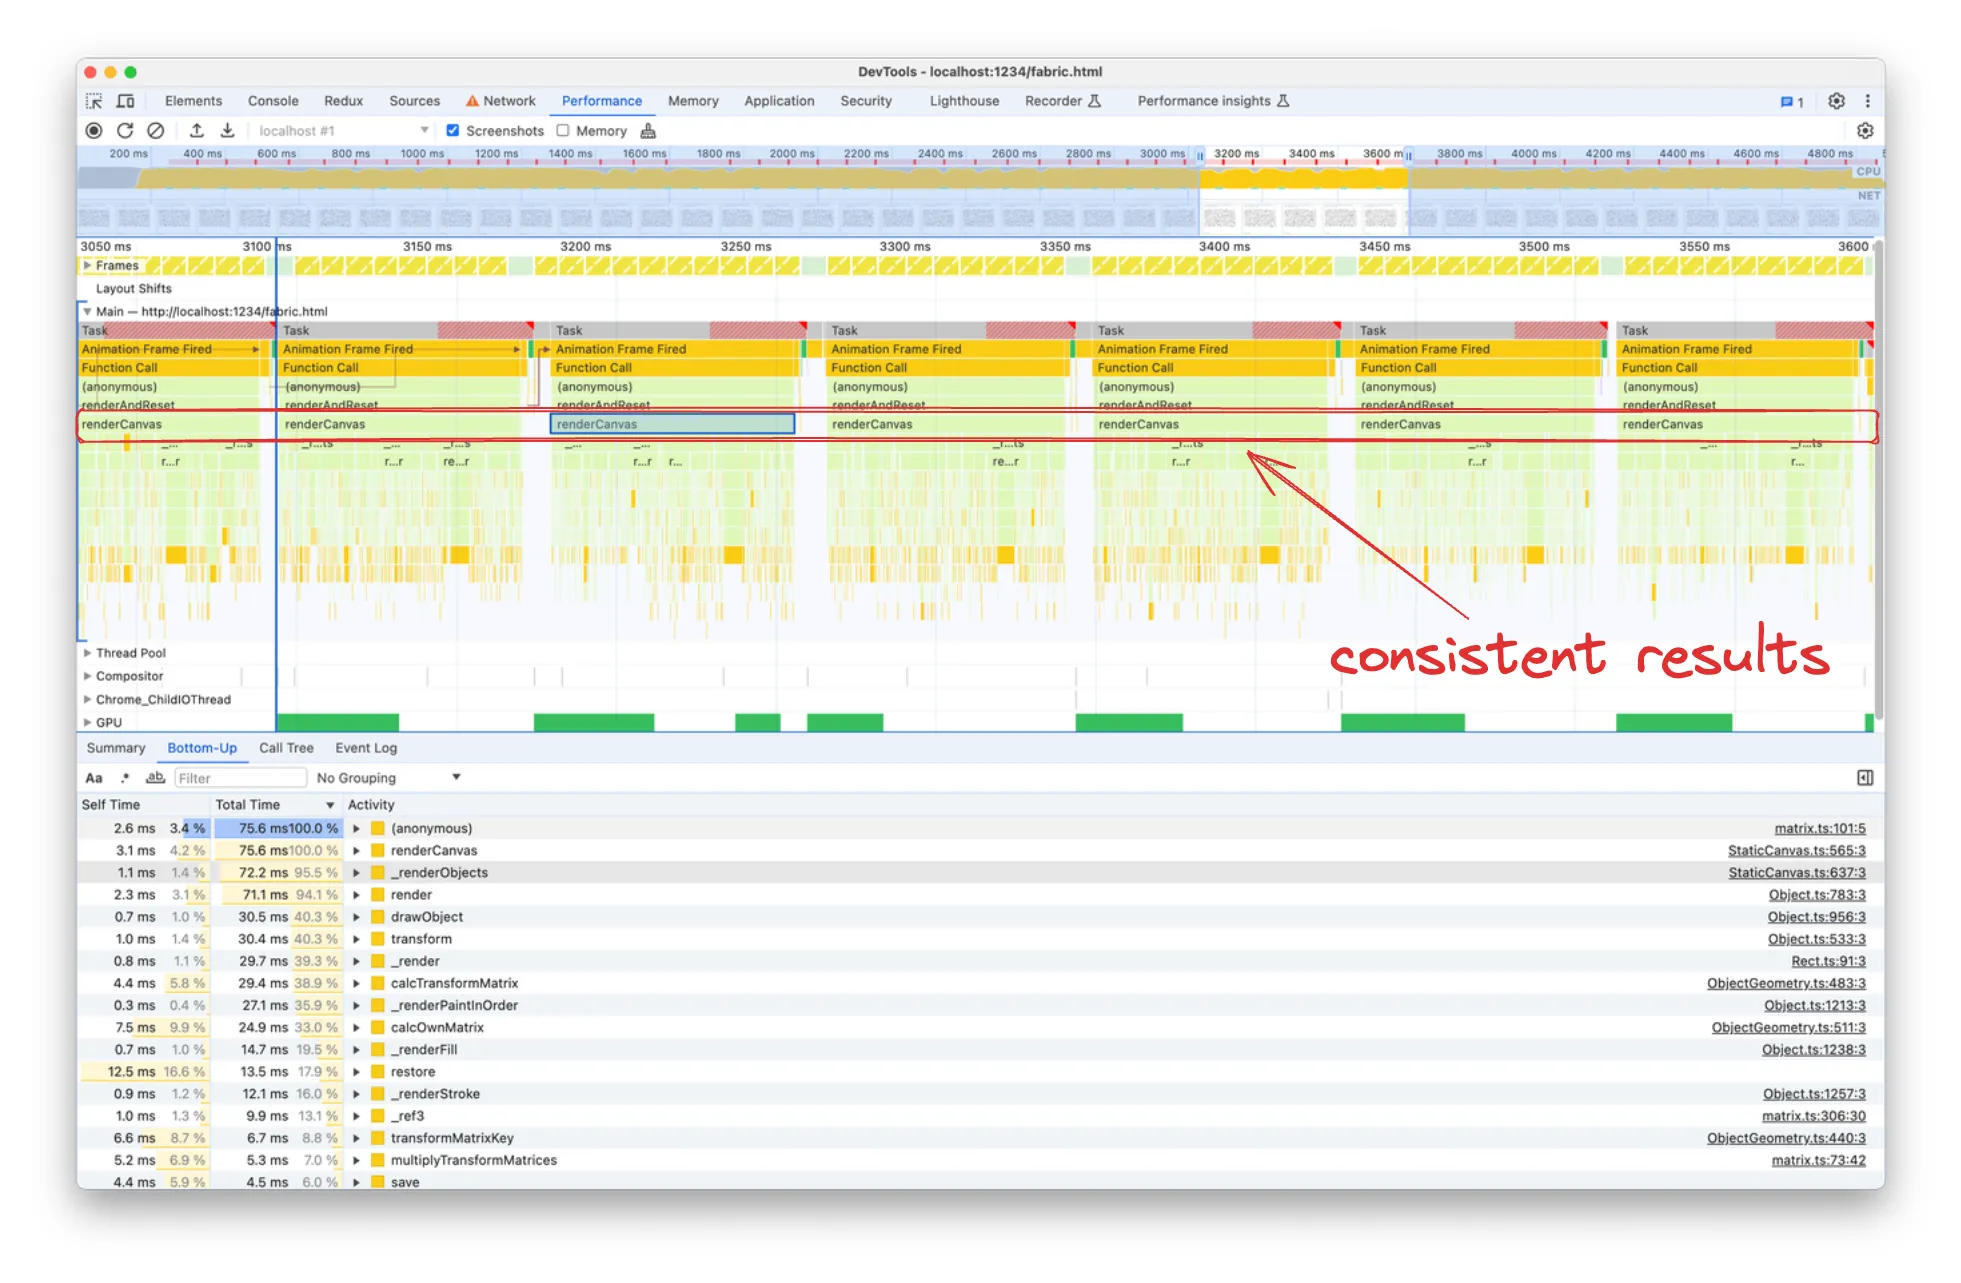
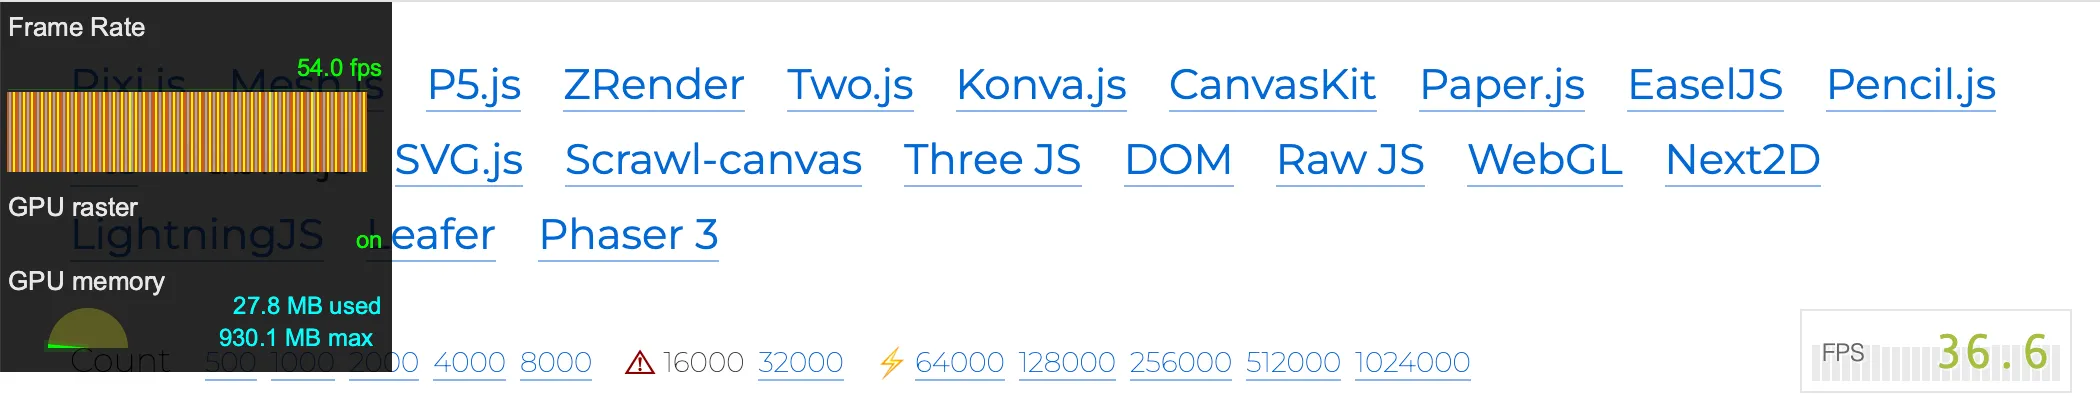
This was our Performance recording after the optimisations guided by the analysis:
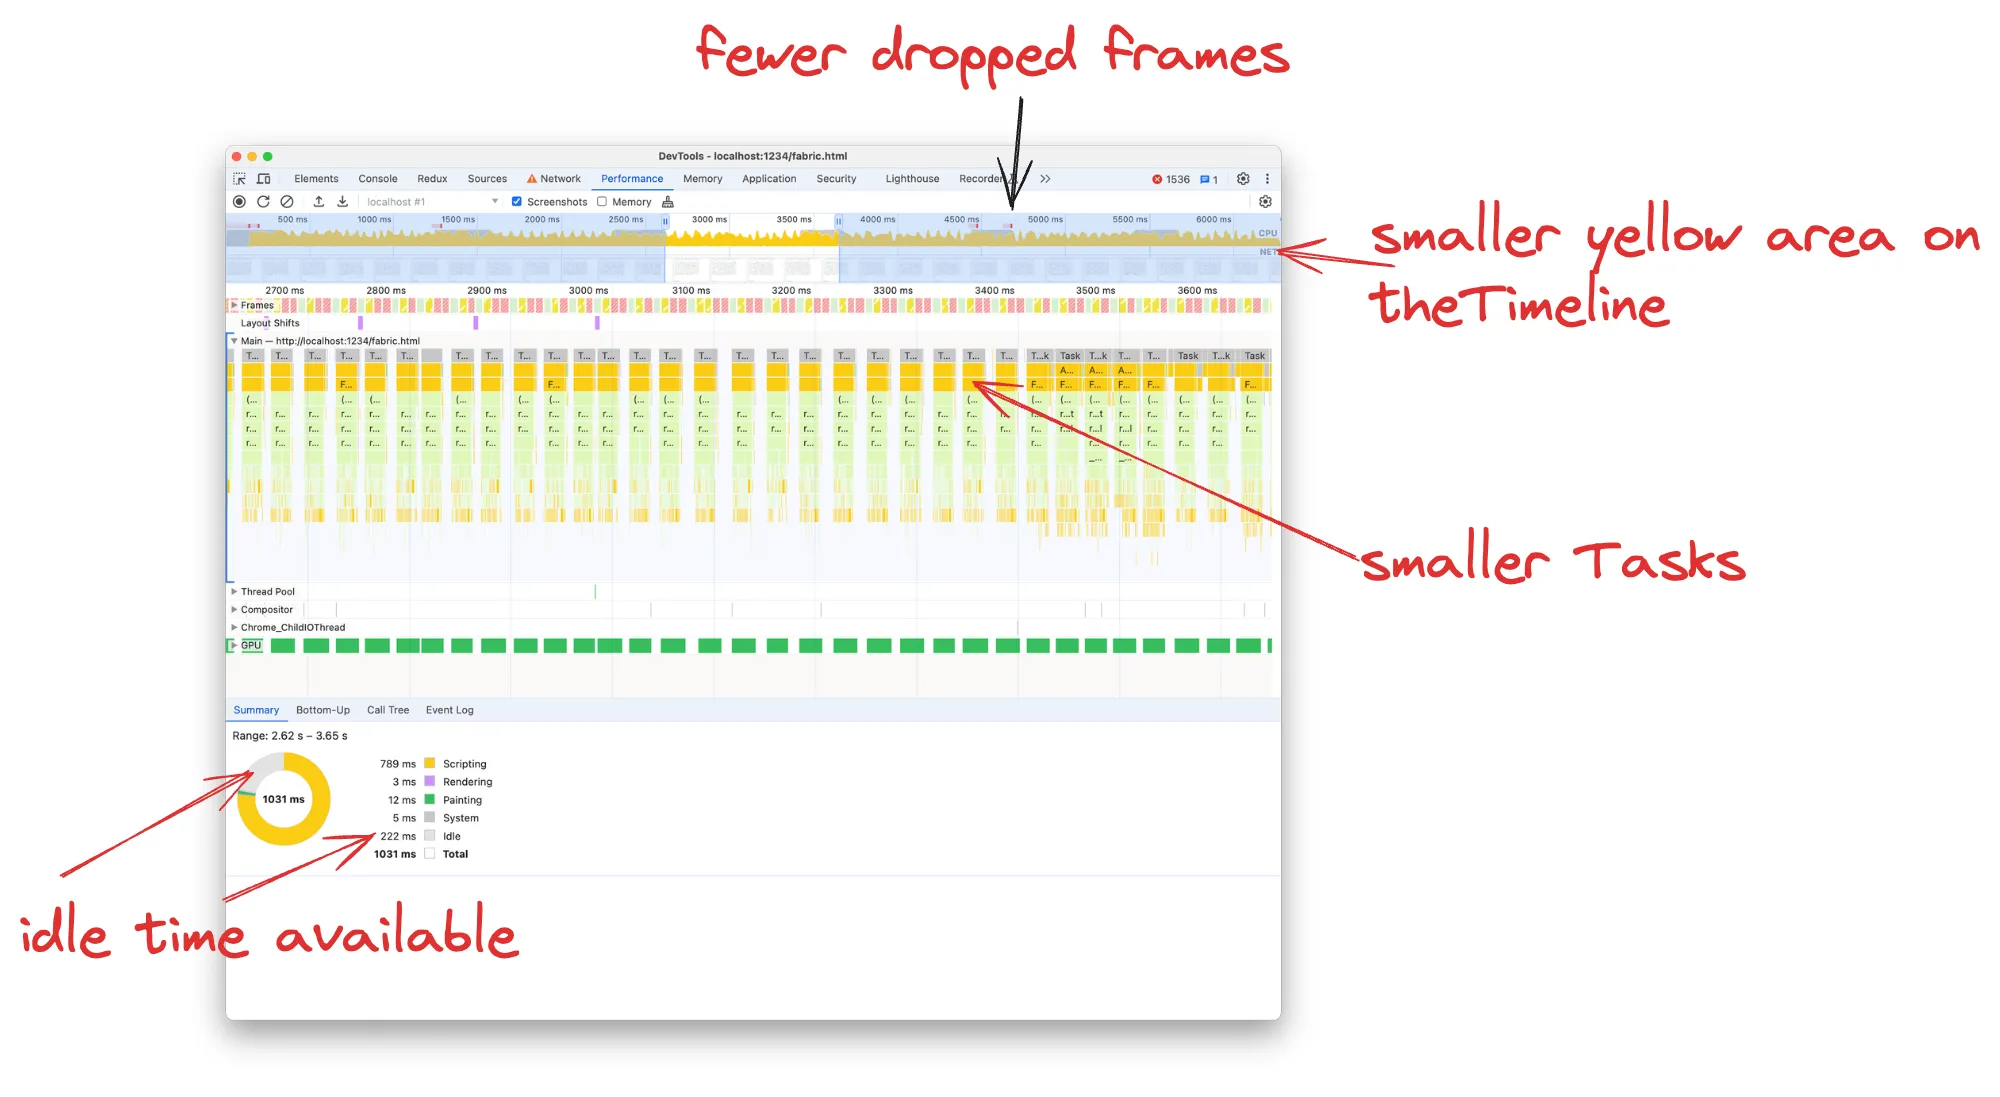
On the Timeline, we can now see overall less yellow area, meaning that we have less JavaScript execution. On the top of the Timeline, we used to have a full-width red line indicating continuously dropped frames, whereas now frames are only dropped occasionally.
Each Task in the flame chart takes now ~20ms instead of 77ms, so we don’t have the red warnings about “Long tasks” as well. The final benchmark FPS meter shows 36fps, whereas the Chrome Devtools FPS meter even displays 54fps
Thank you for reading so far, please leave a comment if you found the article useful. The next article will be about memory analysis.